
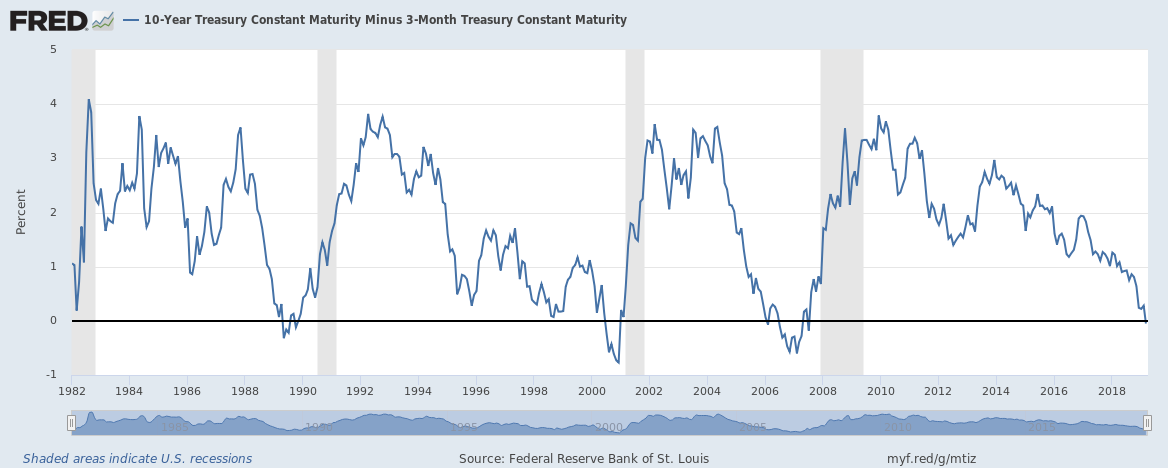
The yield curve inverting is one of the most reliable indicators that a recession is looming in the not-too-distant future. And last Friday, the 10 yr/3 mo yield curve (considered the most accurate) inverted for the first time since January 2006.
Right on cue, the “This Time Is Different!” people started crawling out of the woodwork in every financial news outlet to tell us why the economy is booming, everything is hunky-dory, and an financial indicator with a near-flawless track record is wrong this time.
Most conspiracy theories are mere paranoid delusion, whether it’s “They actually filmed the moon landing on a set in Hollywood” to “9/11 truthers saying jet fuel isn’t hot enough to burn steel”. But occasionally there is a real one. And I suspect that many “This Time Is Different!” articles are published to keep stock market prices propped up long enough for the wealthy to unload their shares on a “greater fool” before the market crashes.
The stock market is mostly owned by the wealthy (84% of the entire stock market is owned by the wealthiest 10%). They know that if they want to sell their stock, they have to convince someone else to buy it. To twist Warren Buffett’s phrase, they need to convice others to be greedy when they should be fearful. And I believe one of the avenues for that is planting “good times lie ahead!” stories in the financial news at the end of the business cycle.
Talking heads will correctly point out that when the bond market inverts, it’s usually 12-24 months before a recession happens. As an investor, I don’t care when a recession officially starts. I care about “when will stock market prices start tanking”, because stock prices usually start falling months before a recession is officially called. The start of the Great Recession was officially December 2007, though the stock market started sliding downhill in July 2007. Similarly for other recessions as well.
Forecasting the stock market is like forecasting the weather. You can see humidity, warm air, sunshine, wind shear several days in advance, but you have no idea if it’s going to mix just right to spawn tornadoes, or merely cause grey skies. Likewise, when I see Brexit, trade wars with Europe and China, Europe and China’s economies slowing down even before the trade war, bad fiscal decisions by Congress, companies starting to downsize and close locations, I can’t tell you whether economic storms lie ahead, or merely grey skies. But I can tell you I’m going to have my umbrella handy, just in case…
Since I’m a big believer in putting my money where my mouth is, I will disclose that I sold 60% of my stocks back in September 2018 and bought bonds (right before the market fell, which was luck on my part). I sold another 20% back in early March. And I will likely sell the last 20% by April, before “Sell in May, go away” season arrives.
I am leaving money on the table by doing this. But the first rule of making money is “don’t lose money”. The second rule is “the reward you earn should be proportional to the risks you bear”.
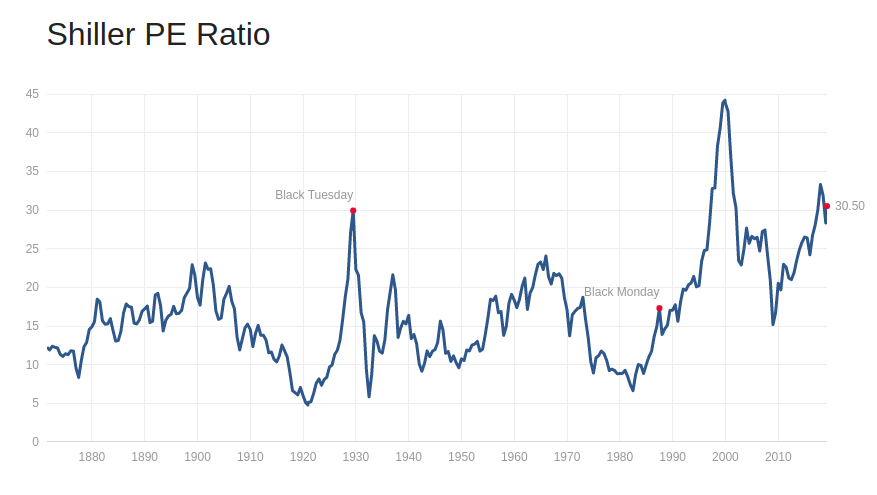
I have outlined the risks I’m aware of above. The reward? Judging by Tobin’s Q and CAPE, the stock market is already highly overvalued. And while the stock market can continue to climb even when overvalued, the stock market loses predictability when its price is based on optimism instead of fundamentals, and can revert to the mean quickly and viciously. So the potential risks are high, while the potential reward is probably low.
Let’s check back here in a year to see if I’m right or Chicken Little…