“For now we see in a mirror, darkly; but then face to face:
now I know in part; but then shall I know fully” – I Corinthians 13:12
The past year I have spent a lot of time contemplating the economy, what is likely to happen the next few years, and how to invest accordingly. Having spent a decade struggling to emerge from the shadow of the Great Recession, it is uncomfortable to think that another recession is lurking just around the corner, yet there are growing signs that one is.
I am writing this to help organize my own thoughts, as well as help others understand and encourage conversation. I may not be exactly right. In fact I’d be rather shocked if I were. But as John Maynard Keynes ventured, “It is better to be approximately right than precisely wrong.” And what’s the point of making predictions if you don’t make them public so other people can ask questions and challenge your thinking?
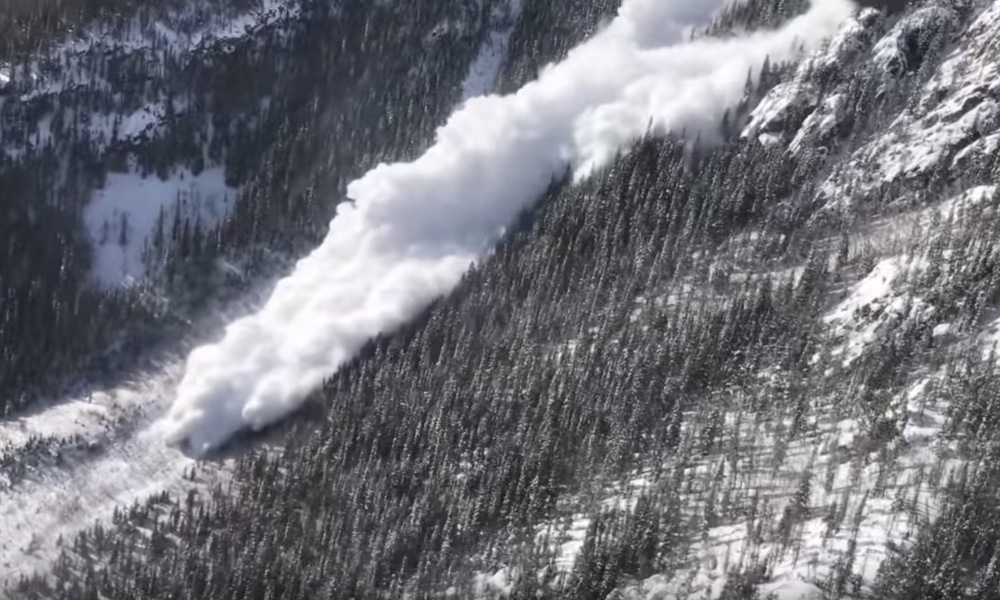
To be clear, it’s nigh impossible to predict exactly *when* a recession will occur. A recession is rather like an avalanche in that regard. You can’t predict *which* snowflake will start an avalanche. But when you see a large pile of snow perched precariously on the mountain, you should probably think twice before going skiing that day.
Similarly, you can’t really predict in advance which event (Brexit, Trump tariffs, Hong Kong, war with Iran, collapse of consumer confidence, sovereign debt crisis in southern Europe, or one of those mysterious Unknown Unknowns) will puncture the economic equilibrium and tilt us into a recession. But you *can* say with good confidence that conditions are coming into focus to allow something like that to happen.
II. Sign that a recession is coming – The Yield Curve
“Why is it when you yield, I feel like the one who has been conquered?”
– Judith McNaught
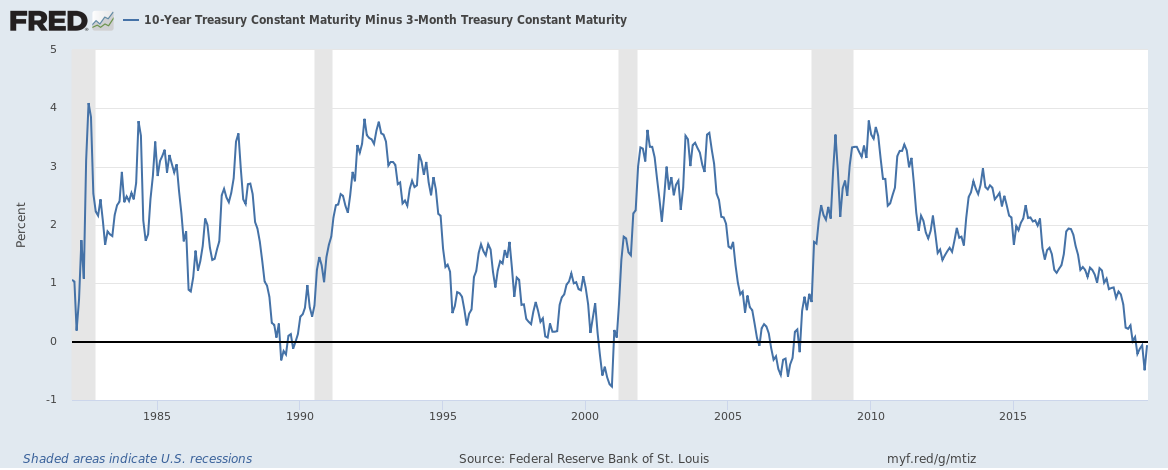
When it comes to economic indicators for forecasting recessions, the “yield curve” is usually considered the most reliable. So what is the yield curve?
Our government sells Treasury bonds that have different maturities (3 months, 2 years, 10 years, and several others). The yield curve is simply the interest rate on the longer-term Treasury minus the interest rate on the shorter-term one. For example, if a 10 year Treasury has an interest rate of 3%, and a 3 month Treasury has an interest rate of 2%, then the “10 year/3 month” yield curve would be 3% – 2% = 1%.
Investors love making money but hate risk. The longer you remain invested in something, the more risk you take, of inflation wiping out your investment, or of missing a better investing opportunity elsewhere. Investors want compensation for the risk of locking their money up for a longer time. So interest rates on longer-term bonds are usually higher than rates on shorter-term bonds, and the yield curve is normally positive.
When the yield curve inverts, it means that short-term Treasuries have *higher* interest rates than longer-term Treasuries. Investors buying short-term Treasuries see higher risk on the near-term horizon, and want to be compensated for bearing that risk.
A so-called “yield curve inversion” has preceded every recession since the 1950’s except one (the economy slowed but avoided a recession during the 60’s). And once the yield curve inverts, a recession almost inevitably follows within 12-24 months. Looking at the yield curve, we can see it inverted in May 2019. Which doesn’t bode well for 2020.
How does the yield curve “predict” recession? Banks earn a profit by “borrowing short and lending long”. That is, when you go to the bank and ask for a mortgage or car loan, they borrow money at the (usually lower) short-term rate, and lend it to you at the (usually higher) higher-term rate, and make money from the difference between the two rates.
When the yield curve inverts, the “high” rate is lower than the “low” rate. It makes lending unprofitable for banks, so they compensate by tightening lending requirements and refusing to lend to marginal borrowers. This makes it difficult for weaker companies, which often have to let employees go or cut back their growth in other ways. Eventually the economy is sufficiently weakened that an event can tilt the economy into recession. So an inverted yield curve doesn’t *predict* recessions, it actively helps *cause* them.
While I believe the yield curve is pointing the way to a recession in the next 6-18 months, there are also important signs that as of yet do *not* show any sign of a recession. For example, if Wall Street was overly worried about the overhang of corporate debt, the interest rate on so-called “junk bonds” would be rising to compensate for the perceived risk. In the 2001 recession, there was a long, slow rise on “junk bond” spreads that actually started 3 years earlier in 1998, and in 2007 there was a steep and rapid rise in junk bond spreads roughly 6 months before the Great Recession was officially called. And yet, looking at junk bond rates, there is no sign of that happening yet.
A recession will happen when it happens, and not when economists want it to happen. In fact, it’s completely conceivable that the US economy manages to dodge all the potential dangers and avoids a recession altogether. That said, I wouldn’t bet on it.
III. What shape will the next recession likely take? – A US “Lost Decade”
“All happy families are alike.
Each unhappy family is unhappy in its own way.” – Leo Tolstoy
The good news: there are few signs that the next recession will be as *deep* as the Great Recession. Consumers aren’t in nearly as much debt as before, and banks are better capitalized. So we are unlikely to see a repeat of the Great Recession.
The bad news: there are signs that the next recession may last *longer* than the Great Recession.
- When a recession hits, the Federal Reserve normally lowers interest rates by ~5% to help stimulate the economy. Since the Fed rate is currently below 2%, the Fed has less headroom to stimulate the economy like they used to.
- The Fed can also engage in what’s called “unconventional monetary policy” like quantitative easing. But quantitative easing has a substantial negative trade-off, in that it transfers wealth from the poor/middle class to the wealthy, exacerbating inequality and increasing the likelihood that future recessions will be *worse*.
This is most visible in real estate, where years of easy money have allowed wealthy investors to purchase a large number of homes and rent them on AirBNB, which has inflated home prices dramatically, and putting extraordinary financial pressure on many poor/middle class folks looking to buy a home. - After a recession hits, Congress often passes a “fiscal stimulus” bill to help the economy by borrowing money and using it to help put Americans back to work.
But today our government’s ability to borrow is constrained due to the size of the deficit. Since Trump was elected, Congress has been on a deficit spending streak, largely to pay for tax cuts for the wealthy, in stark contradiction with what macroeconomics says is prudent. And increased partisanship increases the risk that fiscal stimulus may be too small, or even not passed at all. - There is an *enormous* bubble in corporate debt. Corporations have been borrowing trillions of dollars and giving it back to shareholders in the form of stock buybacks. But eventually that debt will have to be repaid…
- Japan and Europe are in worse economic shape than the US. *Nominal* BOJ interest rates are negative, and negative interest rates are popping up in several EU countries as well. China’s economy is proving to be much weaker than expected. It is thus difficult to find countries with sufficient size and economic vitality to stimulate demand here and help us get back out.
At some point in the next year or two, some event is likely to knock the economy into recession, and once there, we won’t have the usual tools to get ourselves back out. And the corporate debt bubble is likely to constrain growth for years.
This scenario is similar to Japan’s “Lost Decade”. Japanese companies experienced vigorous growth in the 70’s/80’s, which encouraged speculation. When their stock market crashed, those companies suddenly found themselves trapped by debt payments they could no longer afford and could not refinance. So over-leveraged companies were forced to prioritize debt repayment over growth/hiring, which kept Japan’s unemployment rate high, and helped extend Japan’s recovery into a decade-long slog.
Japan’s “Lost Decade” was a textbook example of what economists call a “balance sheet recession“. However, while there are certain similarities (most notably the overhang of corporate debt as well as the impotence of conventional monetary policy), the US situation is somewhat different from Japan’s.
On the positive side, unlike Japan, most US companies are unlikely to be in true danger of insolvency. The ones borrowing the most debt have plenty of money stashed away, but that money is often held abroad to avoid triggering US corporate taxes. So even though they have funds on hand, they may still choose to curtail hiring to avoid paying taxes. This suggests that Congress might be able to spur the economy by passing legislation encouraging/compelling companies to repatriate money from foreign subsidiaries.
IV. How do we recover and get back to normal? – Fixing inequality
“All of this has happened before, and all of it will happen again.”
– Battlestar Galactica
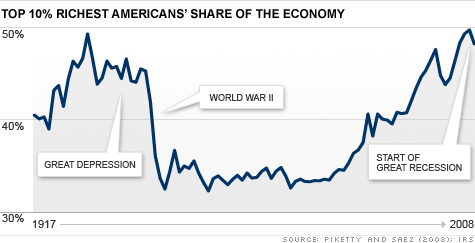
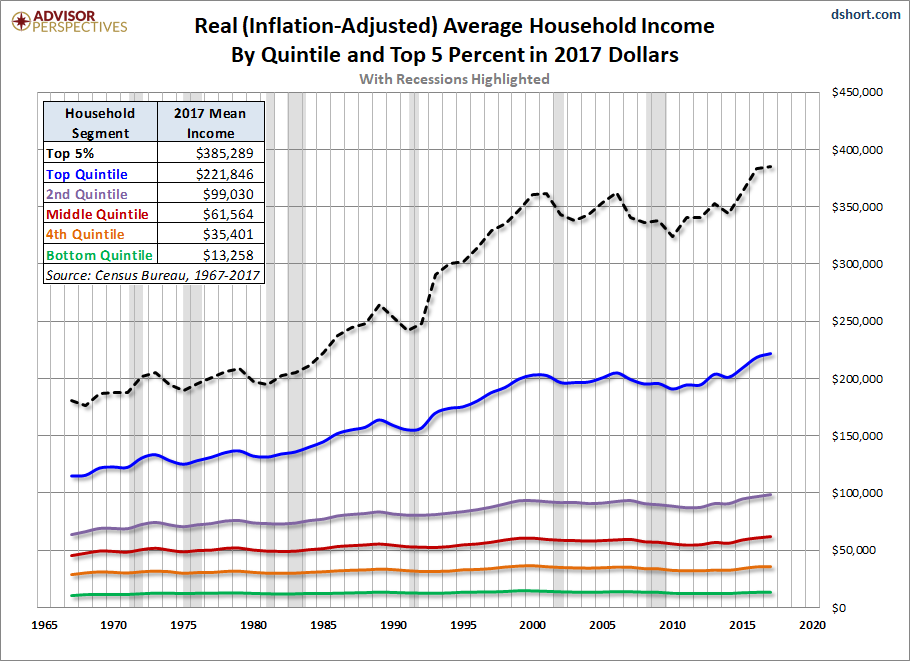
You may have heard someone mention inequality without understanding what it meant. Inequality is simply a measure of how unequal income or wealth is. By definition, the wealthy have more money than the poor. But inequality can grow or shrink, and have extremely consequential economic effects.
As you can see in the graph above, inequality hit record highs right before the Great Depression *and* the Great Recession, and the 1950’s-1970’s that are normally regarded as a golden age of prosperity for most Americans had much lower inequality. That is highly unlikely to be a coincidence.
The poor and middle class spend most or all of their income, often from necessity. Houses, food, utilities, cars, children, healthcare, education often use up their entire salary, so that they couldn’t save even if they wanted to. But the wealthy have the ability to save a significantly part of their income, which they invest so they can become even wealthier.
But over the long term, this can cause serious economic problems. The wealthy earn the lion’s share of their wealth from the stock market, while the poor and middle class see their incomes increase roughly at the same rate as GDP. On average, the stock market grows ~7%/yr in real dollars, significantly faster than the average 3.2%/yr of the economy as a whole. So not only do the wealthy start off with *more* money, their money grows *faster* than everyone else’s, which causes inequality to increase over time. (In fact, historically inequality has only been reduced by war, plague, or other natural disasters, which is one reason why I hope we choose to do so voluntarily this time.)
Please note that I’m not calling the wealthy “evil” or “selfish” (though a certain subset of them *have* used their wealth to game our nation’s laws to their benefit at the expense of everyone else). They’re merely doing what’s in their own best interest, without regard (and often without realization) about the deleterious effects their wealth has on the economy as a whole.
Some may denigrate worrying over inequality as mere “greed”. Who cares if a wealthy person has a luxury mansion, as long as you’re doing good? And if it were that simple, it would probably be true. While I would love to own a home like Bill Gates, I certainly don’t *feel* poor just because his home is nicer home than mine.
The problem is that inequality has macroeconomic effects which *hurt* the poor and middle class. US’s tax policy since the 1980’s has allowed the wealthy to accumulate a “savings glut“. The pile of money the wealthy wants to save has grown larger than the available investment opportunities. Econ 101, when supply exceeds demand, profit falls.
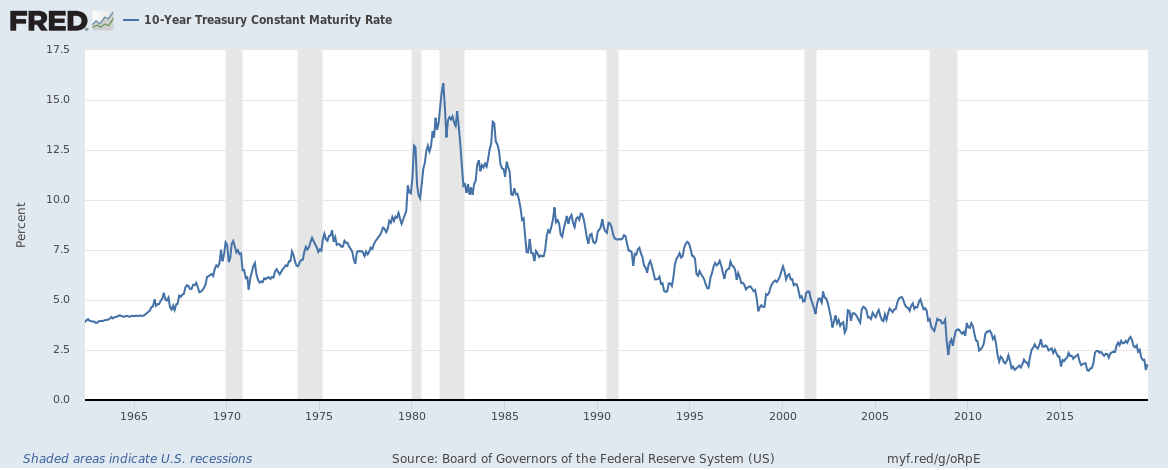
For example, we can see here how the “savings glut” has caused yields on 10 year US Treasuries to fall since 1980:
We can also see similar effects in the stock market. Below is a graph of the Shiller PE ratio. The ratio gives the Price/Earnings ratio based on average inflation-adjusted earnings from the previous 10 years, and as such, provides a useful estimate of whether the stock market is “overvalued” or “undervalued”. 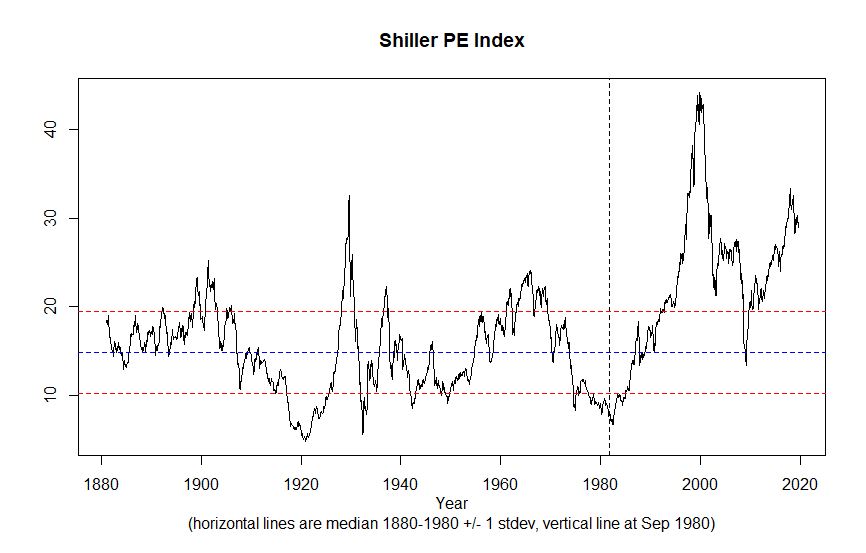
From the graph above, you can see two things: 1) a long-term growth trend in “overvaluation” started in 1980, and 2) today the stock market is highly overvalued by historical standards, exceeded only by the Great Depression and Great Recession.
Just as a *falling* bond yield means less profit for new investors, a *rising* stock market overvaluation makes it relatively more expensive for new investors to buy stocks, as they are paying a growing premium price relative to earnings. The profit here is falling too…
As the “savings glut” has persisted across both Republican and Democratic tenures in office, the fault doesn’t lie with any particular political party, as they both have a largely unblemished track record of kowtowing to the wealthy at everyone else’s expense. And as inequality has been a problem decades in the making, it will likewise probably require decades to correct. So the sooner we start, the better.
Falling long-term interest rates are great if you’re borrowing for a home or car. But they are bad if you’re a retiree depending on CD/bond income for your retirement, or if you’re trying to save for retirement. The average 50-59 person only has $174,100 in their 401k, and a 5% return only yields $8,705 per year. Even combined with Social Security, the average person will only have ~$25,000 per year to live on. Meaning that many retirees will likely be working until they die of old age because they simply *cannot* afford to retire.
And on a larger scale, the “savings glut” is hindering the Federal Reserve’s ability to fight a recession. As mentioned earlier, when a recession strikes, the Fed has normally lowered rates by ~5%. This makes borrowing cheaper, which encourages investors to borrow and spend on homes, factories, infrastructure, and other things which help put people back to work and rev the economy back up. But with rates that will likely hover below 2% within a few weeks, the Fed simply *can’t* stimulate the economy as much as it used to. Once a recession hits, the end result is likely to be more poor and middle-class people unemployed for longer periods of time.
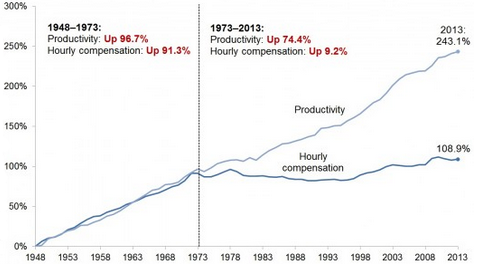
The flip side of the wealthy’s “savings glut” is an “income deficit” for the poor and middle-class. For several decades starting in the late 1940’s, whenever worker productivity increased, their incomes increased proportionately, which helped inequality relatively low and led to a strong and growing middle class. Starting in the mid-1970’s, that relationship broke down. Money that had previously been shared with workers increasingly started to be horded by the owners of the companies instead. Consequently, for many workers their incomes either haven’t grown in real terms in decades, or have actually fallen.
America has previously experienced eras of “creative destruction” from automation that have eliminated entire job sectors. You’ll notice there’s no longer a huge horse and buggy industry, as those jobs were destroyed when the automobile was invented. The current problem with automation is two-fold: The rate of automation is increasing so that jobs are being destroyed faster than new ones can be created, and the rewards for automating are accruing to an ever-shrinking portion of wealthy Americans. So automation is hastening an already painful increase in inequality.
There are two ways of tackling the “savings glut” at the heart of inequality: From the “demand side”, by using deficit spending to “create” new investments, or from the “supply side”, by taxing the wealthy so they have less to save, and distributing it to the poor/middle class to counteract their “income deficit”.
The deficit spending required by the “demand side” has a huge downside. Except for a brief period during Bill Clinton’s presidency, the federal debt has increased unabated since shortly after World War 2. But someone, someday will eventually have to pay that debt. And there are growing signs that it will be *this generation*. This is no longer our grandchildren’s problem. It is our grandchildren’s grandparent’s problem.
There are three ways to pay for deficit spending: by raising taxes on the wealthy, by cutting services (mostly used by the poor/middle class), or by debasing the dollar via inflation (which mostly hurts wealthy lenders). As no politician is likely to get elected on the promise of raising taxes or cutting services, seeing the dollar debased is the most likely outcome.
By contrast, increasing taxes on the wealthy has fewer negative side-effects. Not only does it eliminate the savings glut, we can use those taxes to pay the debt, pay for infrastructure, pay for healthcare and education, and cut taxes on the poor/middle class to reduce the income deficit. And their increased income would likely yield a roaring economy.
As our country is run by the wealthy, for the wealthy, our elected officials have only tried deficit spending over the past 4+ decades. And all most of us have gotten from it is more debt, more inequality, and a more unstable economy. Inequality will keep us caught in a cycle of worse-than-usual recessions and weaker-than-usual recoveries until such time as we get serious about fixing it.


Good information, sad situation. Presently we are poorer yet in leaders that see the need of doing something/anything to help our economy. Only for short periods in history do you see the poor prospering. The potato famine and such events brought most of our ancestors to America. We have lived in a time of plenty for more people than any time in past history. I don’t see that as being the future for the poor and fading middle class of today. The thing is this time most of the rich will suffer too. Global warming will cause food to be scarce. In N. Korea all food belongs to the government. Governments all over the world are falling into the hands of a few people who care little amount the masses. Revelations is not so hard to understand now. It talks about global warming, probable asteroids colliding with the earth, the life in the oceans dying, water not fit to drink, events being view by everyone on earth, economic failure, etc. Things neither John or anyone else had a way of knowing about when he recorded the events he foresaw.