“History doesn’t repeat itself,
but it often rhymes.” – Mark Twain
Quick quiz…
- Inequality and a major economic crisis have made it increasingly difficult for the poor/ middle class to get ahead, and many feel themselves falling behind.
- As a result, demagogues have begun attempting to seize power in many countries including the United States since existing parties won’t fix things.
- Countries have begin joining or strengthening military alliances and many see the growing prospect for another major World War.
Am I talking about 2008-2023, or 1929-1939’s?
“Coincidence is the word we use when we can’t see
the levers and pulleys.” – Emma Bull
It isn’t a coincidence. There are similar economic, political, and geopolitical forces working in 2007-2023 as there were in 1929-1939 (as well as in other historical eras).
Since we see the misery those forces are currently causing, and know that the last cycle eventually led to the Great Depression and World War 2, enlightened self-interest should encourage us to disrupt this cycle before it gets worse (and it assuredly will get worse before it gets better).
That doesn’t necessarily mean that 2020’s China/Russia will play the part of 1940’s Germany or that 2020’s US will be the “good guys” and save the world like it did in the 1940’s.
Right now, the US has to save *itself* first…
“All of this has happened before,
and it will all happen again.” – J.M Barrie
Many things in nature come in cycles. Whether it is the seasons, sunspots, the tides, life and death. So it is in politics and economics. We have the election cycle every 4 years where we determine who leads us, the business cycle of booms and crashes every few years.
These cycles occur on a timescale that is much shorter than a human life. That is why most people are aware of them: They have seen multiple recessions, multiple presidents in their lifetimes. To them such things are a normal part of life.
But there are other cycles that move on longer timescales than a human lifetime, and so most people are unaware of them. It’s hard for people to learn hard-won lessons about events that might have last occurred when their great-grandparents were still children.
There are three historically significant “cycles of chaos” playing out in our world today that could soon make our lives much more challenging if they aren’t carefully managed:
- Internal Chaos: Inequality and Demagogues
- External Chaos: Hegemonic Rivalry, the Thucydides Trap, and World War
- Environment Chaos: Climate Change and the “Tragedy of the Commons”
These cycles are as old as humanity, but historically were local/regional affairs as contemporary technology did not allow global reach. Today they each pose a global threat.
- A world hegemon such as the United States falling under the sway of a demagogue has vastly higher stakes for both the country and the world than a smaller and less crucial country such as Venezuela.
- Conventional war between 17th century England and France didn’t threaten global catastrophe like nuclear war between 21st century US and China.
- Easter Islanders famously killed themselves off by destroying their island’s ecosystem, but that localized destruction didn’t affect humans elsewhere. Today CO2 released anywhere harms the entire planet’s ecosystem.
The modern era marks the first time in history when all three destructive cycles are capable of global impact at the same time all three are simultaneously flirting with “gimbal lock”.
Sadly these cycles don’t require any exotic sociological “dark matter” to explain. They’re largely driven by the greed of the wealthy, corruption of political elites, ignorance of commoners, and humanity’s short-sighted nature.
They’re also driven by “normalcy bias”, which is a tendency for people to disbelieve or minimize risks and underestimate the likelihood of disaster. Despite thousands of years of war, natural disasters, economic collapse and other miseries, there is a strong tendency for a majority of the population to believe “that can’t happen now”, even in the face of strong evidence that it *is* happening now.
So we hope to learn about them here, that we might not have to learn about them elsewhere in much less pleasant ways…
I. Inequality and Demagogues
“All the armies of Europe, Asia, and Africa combined … could not by force take a drink from the Ohio or make a track on the Blue Ridge in a trial of a thousand years.
At what point then is the approach of danger to be expected? I answer… If destruction be our lot we must ourselves be its author and finisher.” – Abraham Lincoln
Most of us have noticed two seemingly disconnected truths in recent years: Our politics is getting more toxic and the country less united as time goes by, and the wealthy are doing better than ever while regular people are struggling harder than ever to get by.
As it turns out, those “disconnected” truths are actually joined at the hip, as we will see.
It’s a bit challenging to explain the dangers of demagogues to Americans, because we have been fortunate in our history to have so few of them successfully attain higher office. In trying to describe to readers how the “inequality -> demagogue” cycle progresses, I found myself returning to a quote by Yoda from “The Phantom Menace”:
1. “Fear leads to anger.”
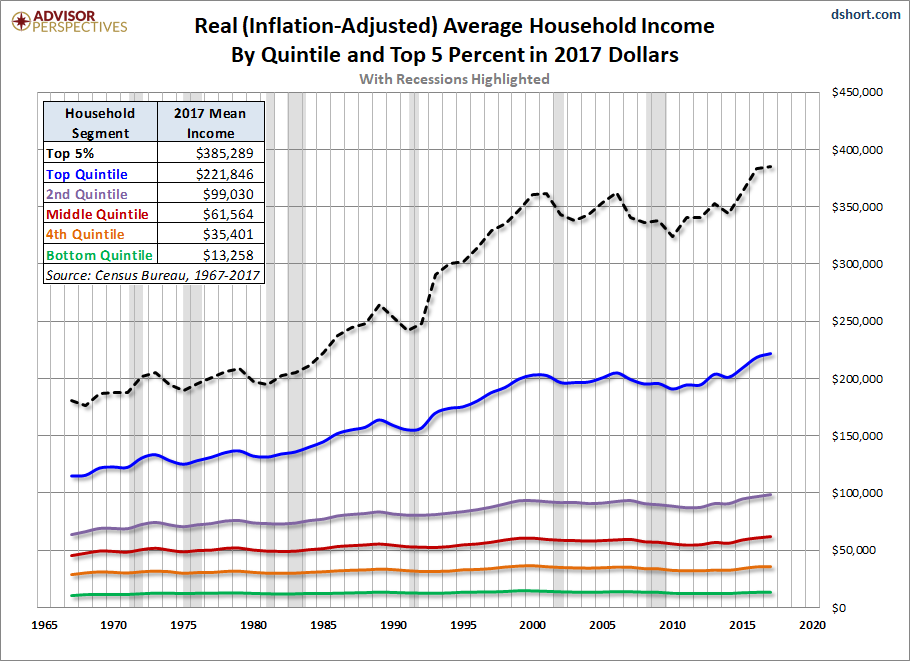
A fact which summarizes our inequality problem: the real wage of a US worker today is less than it was 40 years ago—but there are four times as many multimillionaires.
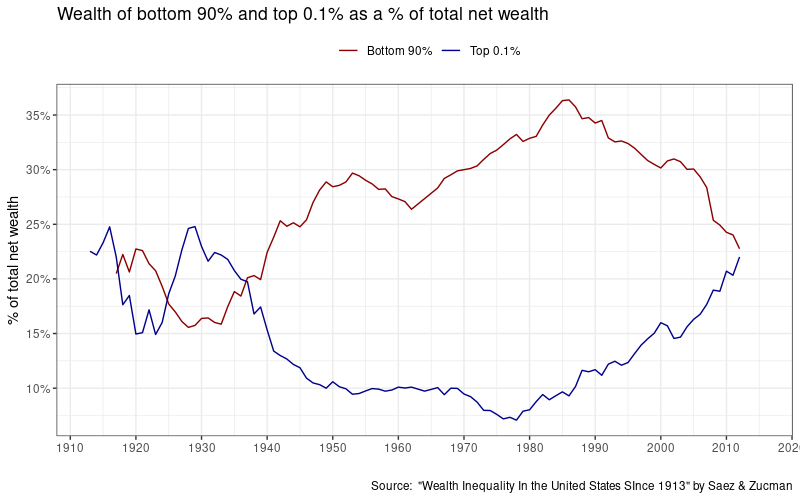
Looking at one measure of inequality (top 1% vs bottom 90% shares of wealth), which we have data back to 1913, we see that it is to a good degree a zero-sum calculus: Increases in share of wealth for the wealthy result in decreases in wealth for the poor and middle class, and vice-versa.
 Economic historian Peter Turchin discovered a cyclical pattern in US history, as well as other countries. While a full discussion would require an entire book (read Turchin’s “Ages of Discord” for that), when Turchin graphed the average of trends that primarily affect poor/middle class people (employment, wages, life expectancy, average height, and age of first marriage) against trends that primarily affect the wealthy (largest fortune to average wage, cost of an elite education, political polarization), he discovered that good times for the wealthy come at the expense of the poor and middle class.
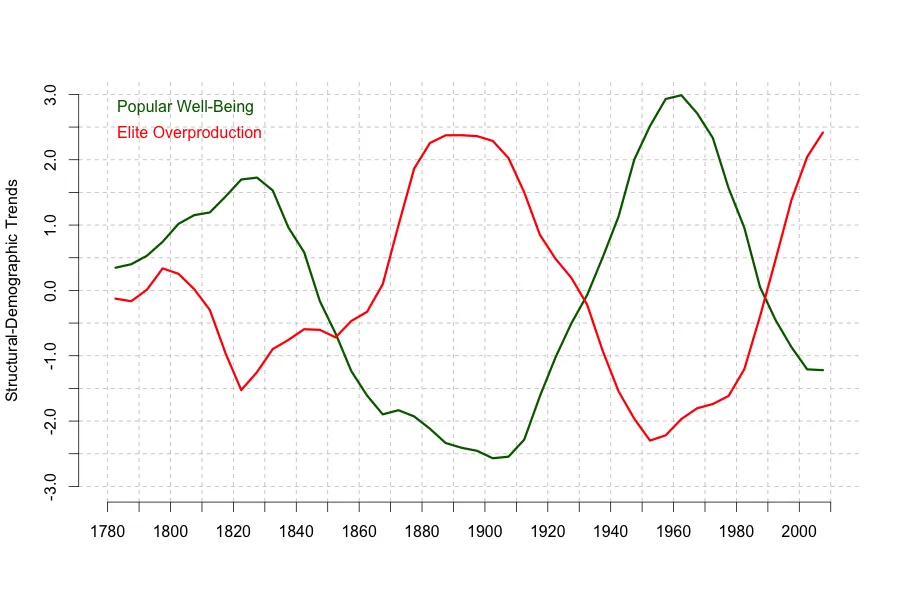 The peaks for “Popular Well-Being” around 1820-1840 (the “Era of Good Feelings”) and 1950-1970 were widely considered “good times” by the average person in those eras, while the lows (the “Gilded Age” of the 19th century from 1870-1900 and the modern era) were considered relatively bleak and miserable for the average person. The exact opposite is true for the wealthy: they’ve never been wealthier than the Gilded Age and our current era.
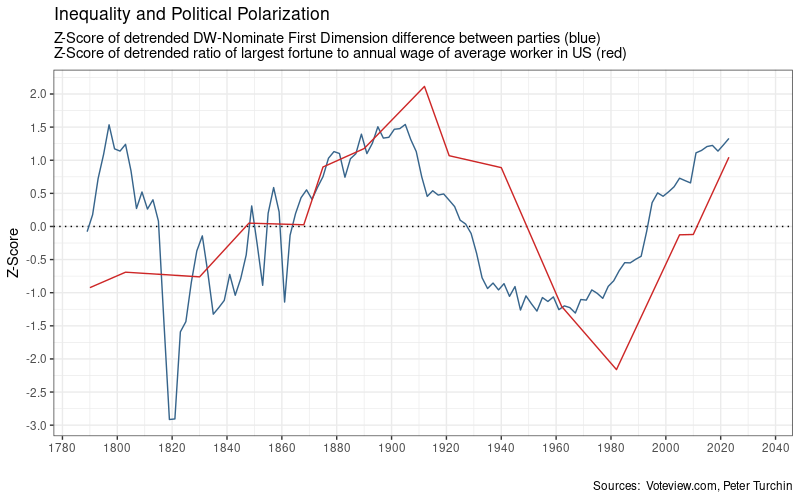
Our politics has become noticeably more toxic in recent years *because* inequality and political polarization go hand-in-hand. The above graph shows a measure of political polarization (differences between political parties DW-Nominate First Dimension) and a measure of inequality (ratio of the largest US fortune to the average annual wage) going back to 1780.
You can see that when one worsens, so does the other, and vice-versa. The likely cause is the wealthy’s predilection of “buying” politicians to craft laws that help them become ever wealthier, often at everyone else’s expense. Thanks to that dynamic, inequality has once again approached the immiserating levels of the Gilded Age.
“The problem is that we all too often have socialism for the rich and rugged free enterprise capitalism for the poor. ”
– Martin Luther King Jr.
Today, both major parties have been captured by the wealthy. The GOP and its historical predecessors (the Federalist and Whig parties) have always been been the party of the wealthy and big business since the founding of the Republic, and the Democratic Party has been spending increasing amounts of time catering to the whims of Wall Street Democrats since Clinton was elected in 1992 (and who helped accelerate the outsourcing-to-China trend that caused an exodus of rural jobs which is fueling discontent today).
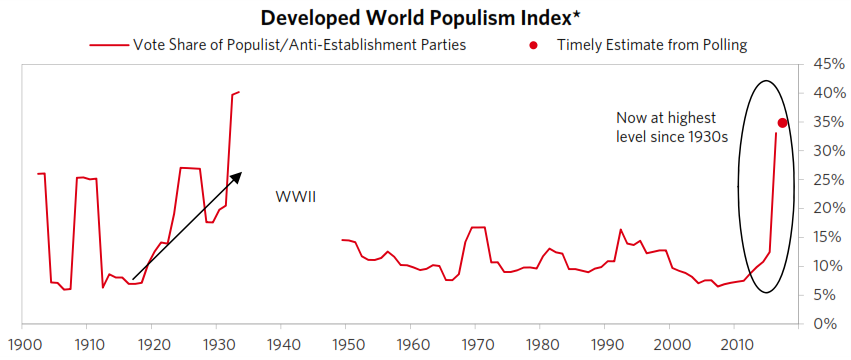
When struggling people don’t see either party trying to help them, in desperation they often turn to radical candidates who promise to help them. Which helps explains the recent rise of Trump, as well as populists in other countries like India (Modi), Brazil (Bolsonero), Hungary (Orbán) and the Philippines (Duterte).
2. “Anger leads to Hate.”
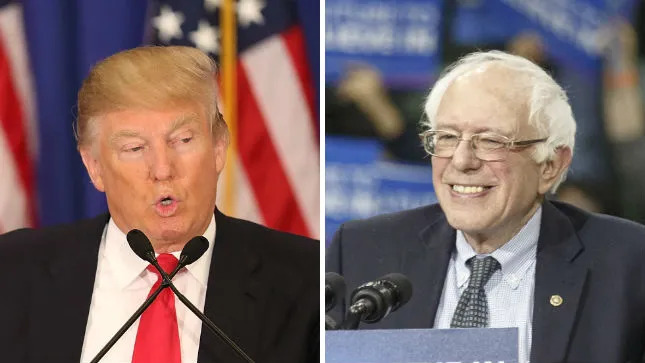 Populists can be relatively benign or even good (think Bernie Sanders or Ross Perot), but some can be malign (Donald Trump). We tend to call the latter “demagogues”.
Demagogues throughout history have had a number of similarities.:
- They are are usually charismatic and often craft a “cult of personality” around themselves.
- They have an anti-intellectual bent and use simplistic messaging with promises of “easy solutions”.
- They foment social division with an “Us vs Them” mentality.
- They are emotionally manipulative and exaggerate threats to stir the fears/anxieties of their supporters
- They have authoritarian tendencies and try to concentrate power around themselves.
It is no coincidence that the last major outbreak of demagoguery was in the run-up to World War 2. A public that had been economically crushed by the Great Depression was desperate and more receptive to the messages of fascists and communist, much as current inequality has made many receptive to the message of MAGA. In hindsight the US is quite fortunate that the “demagogue” voters ultimately turned to was Franklin D. Roosevelt.
“As long as there are crazed or crafty leaders to play on old fears, a mob will turn cruel.” – Leigh Brackett
Demagogues are rarely competent leaders, and often attempt to distract the public from their failings by scapegoating other groups (blacks, women, gays, Jews, Catholics, Muslims, etc.) Those groups often find themselves persecuted by groups and individuals aligned with the demagogue. Historically, this has often led to sectarian violence, whether low-intensity (the Irish “troubles”), mid-intensity (Jan 6 or Shay’s Rebellion) or full-blown civil war (Unions vs Confederates) .
3. “Hate leads to Suffering.”
Demagogues have an unfortunate tendency to prioritize their political stability and survival over economic considerations, loyalty over capability, which over time breeds economic stagnation, corruption and instability.
History is replete with names of demagogues large and small (Hitler, Stalin, Mugabe, Ceaușescu, Marcos, Gaddafi, Chavez) who did so and are today synonymous with failed countries, ruined economies, and widespread human misery.
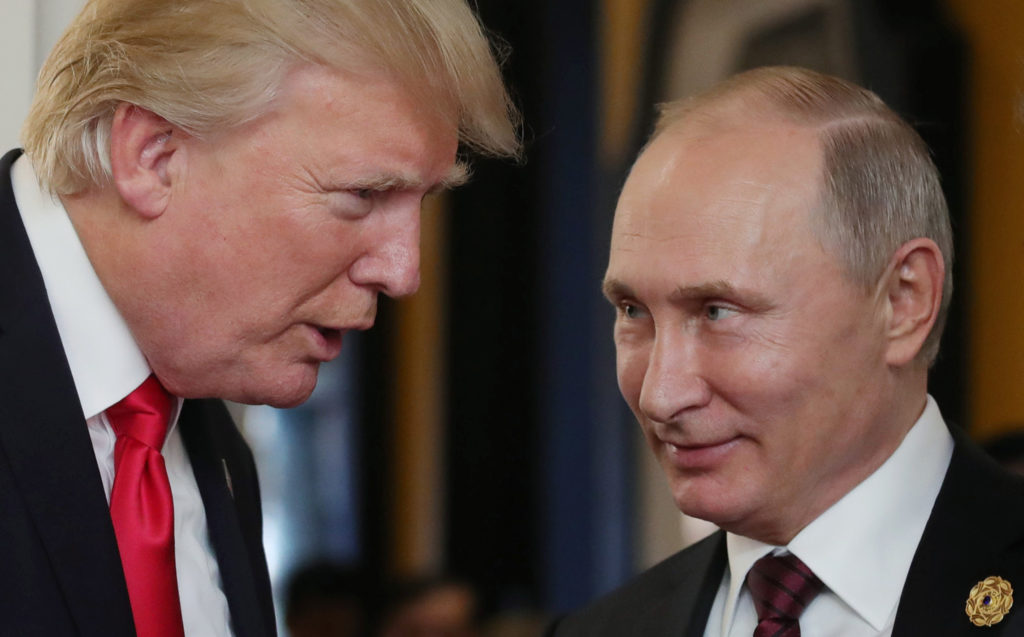
Demagogues also often align themselves with authoritarian leaders in other countries due to shared rivals, ideologies, economic interests, or a need for mutual support and recognition. This has result in alliances such as Napoleon Bonaparte and Grigory Potemkin (late 18th century), Hitler and Mussolini (1930s-1940s), Stalin and Mao Zedong (mid-20th century), Gaddafi and Chavez (2000s), Trump and Putin (today) and numerous others.
“Beware the leader who bangs the drums of war in order to whip the citizenry into a patriotic fervor, for patriotism is indeed a double-edged sword. It both emboldens the blood, just as it narrows the mind.” – Albert Einstein
Demagogues are usually not blind to their failings, and often turn to war or the threat of war to distract the population, shore up their popularity and power, expand their empires, and/or refill bare coffers. Not every demagogue turns out to be a Hitler or Stalin, but the more you elect, the greater the odds of getting a historically awful one.
Even “benign” demagogues like Mugabe and Chavez/Maduro tend to eventually mismanage their countries into catastrophic losses. Which may not affect the world as a whole, but is devastating to the citizens of those countries
What’s behind the rise in inequality?
*Some* inequality is inevitable, even good. Humanity is better off when hard work is rewarded and laziness punished. But the extreme punishing inequality we see today didn’t “just happen”. It was the result of the American public being plundered in multiple ways over decades, abetted by the policy decisions of elected leaders who often benefited politically and/or financially by those policies.
Over the past 40 years the wealthy have pilfered the poor and middle class by at least three avenues (and possibly others):
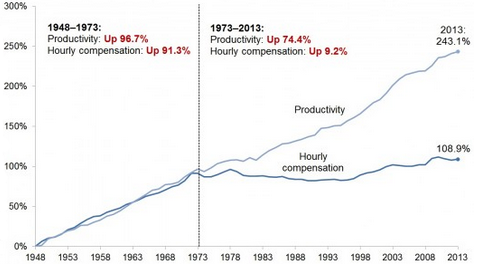
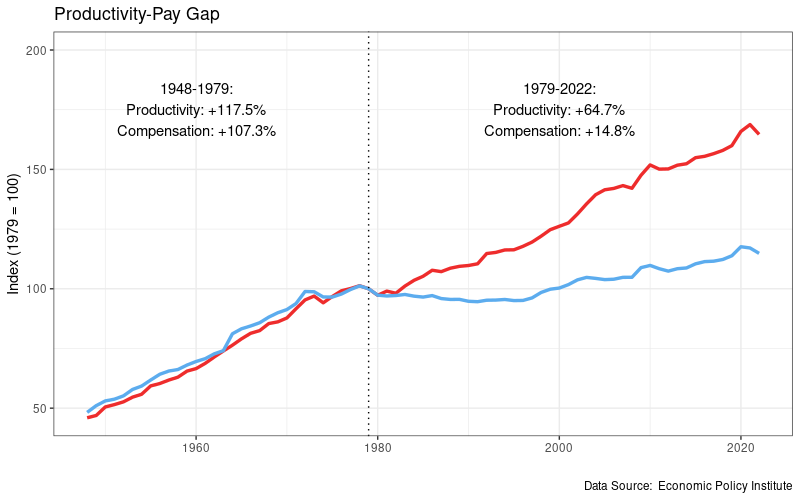
1. The Productivity-Pay gap. From 1948 – 1979, worker’s incomes grew proportionally to worker’s productivity increases. Since the 1980’s, several factors (automation/off-shoring, decline of unions, recovery of world manufacturing from WW2) conspired to give the wealthy more bargaining power vs labor.
The erosion of labor’s bargaining power allowed the wealthy to capture an increasing amount of wealth from labor’s productivity increases. The Economic Policy Institute estimates that the average worker’s salary would be $9/hr higher today if pay had kept up with increases in productivity.
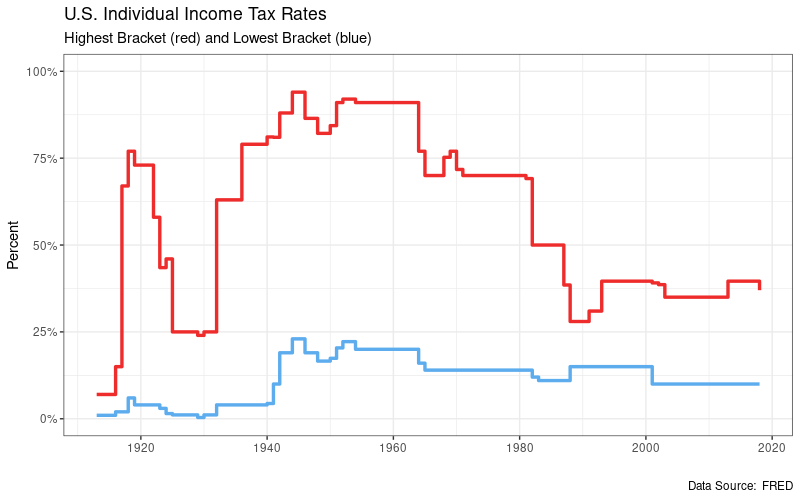
2. Income tax rates. Income taxes were drastically lowered on the wealthy, without a proportional drop in tax rates on the poor/middle class. This had the effect of transferring a large portion of the Federal tax burden from the wealthy to the poor/middle class (or to future Americans, as we’ll see in the next point).
 3. Borrowing and Debt.
“The more you borrow, the less you have.”
– Native American Proverb
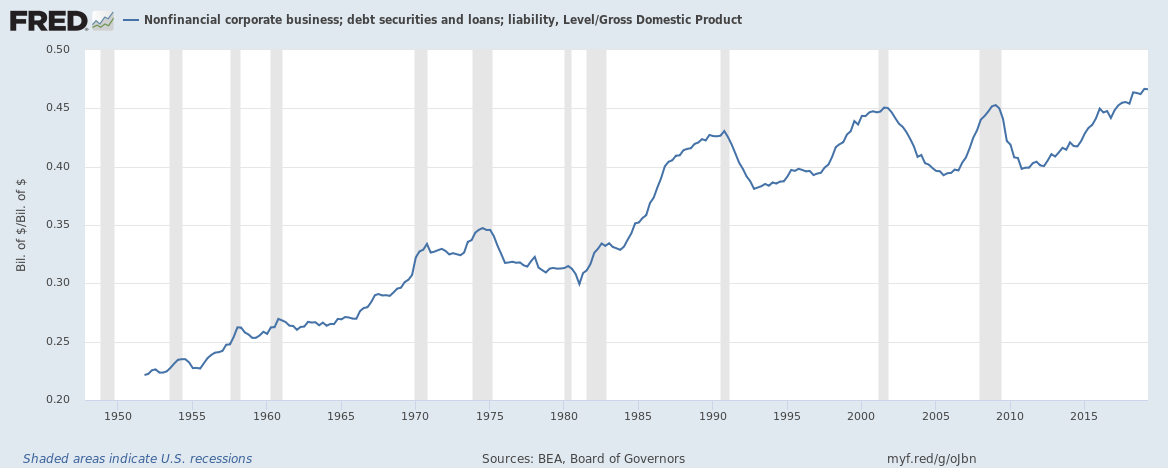
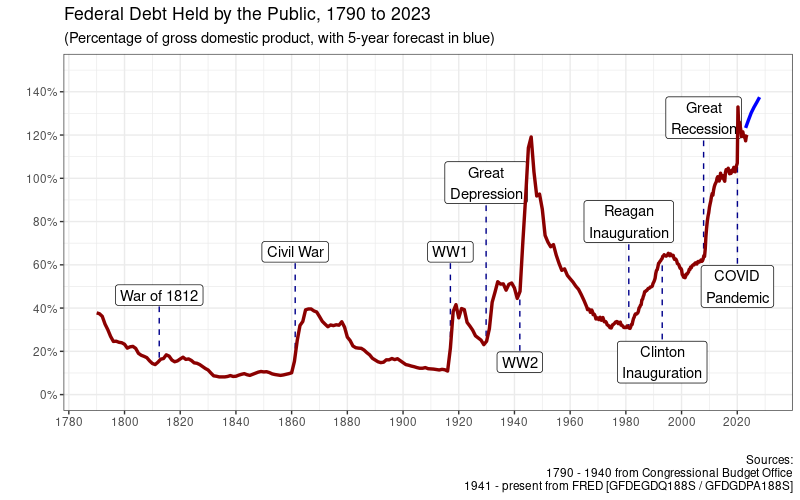
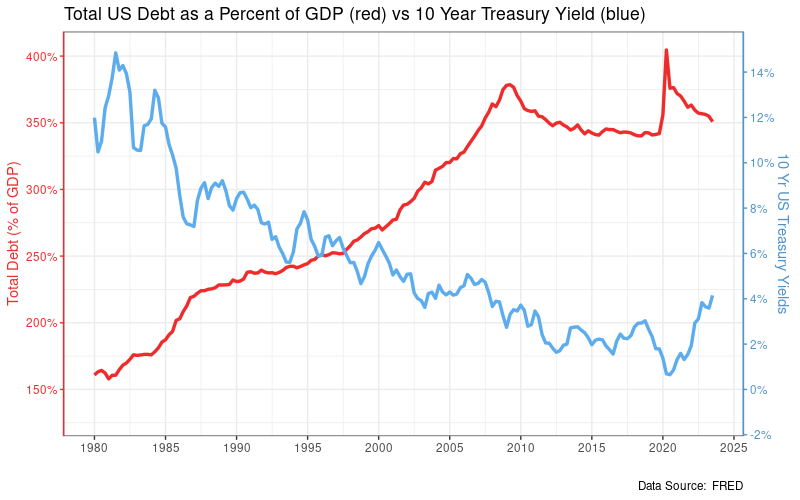
The US has been on a debt binge the last 40 years. Federal debt is the highest it has been in our country’s history, and so is our total debt (federal, state, and local governments; business; personal). We have accrued a higher debt load than we did when we were fighting World War 2. (Thankfully we don’t have any countries threatening another World War, like China and Russia, or we’d be in real trouble…)
Productive debt can make you richer in the long term (think buying a home, paying for an education, or building a factory), but an awful lot of debt has been unproductive, whether it’s wasted on big trucks or big wars in the Middle East.
The accumulated $80 trillion in borrowed funds made Americans feel wealthier than we truly are. While debt often doesn’t truly make you richer, you may *feel* richer with a little extra temporary money in your wallet, even though it must eventually be repaid.
But it definitely makes the companies you spend that extra money with wealthier. By encouraging a debt-fueled spending binge, wealthy Americans in the 1980’s effectively picked the pockets of poor/middle class Americans in the 2020’s. But as we will see the bill is about to come due and the debt must be paid down.
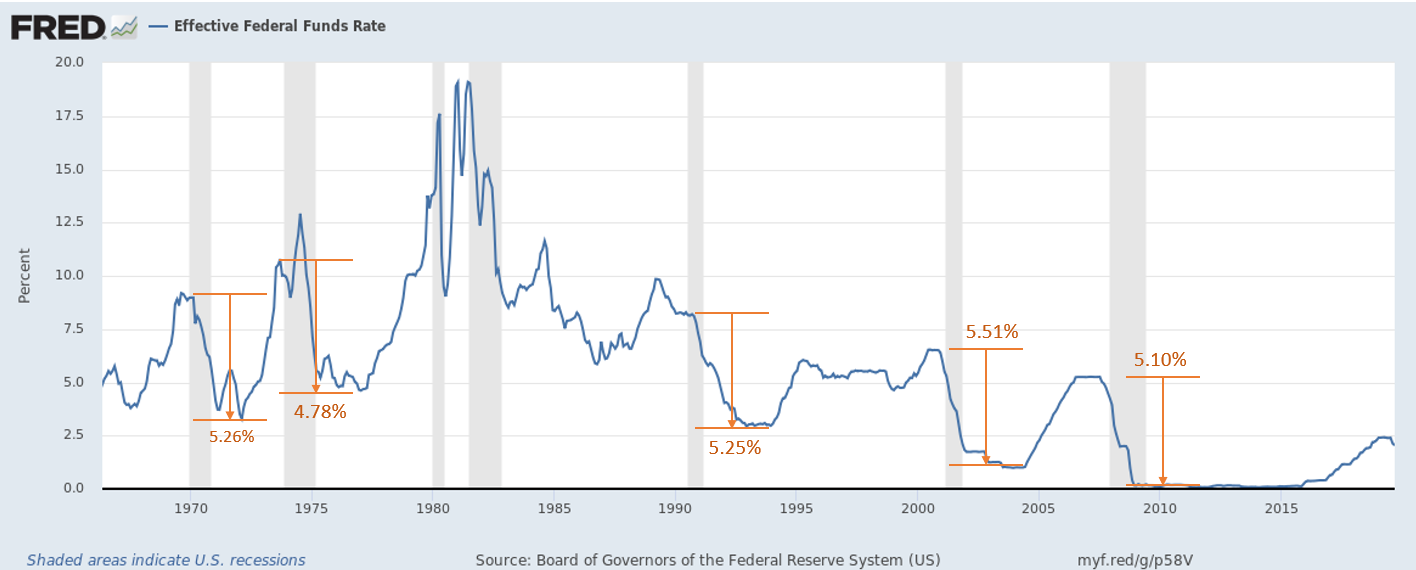
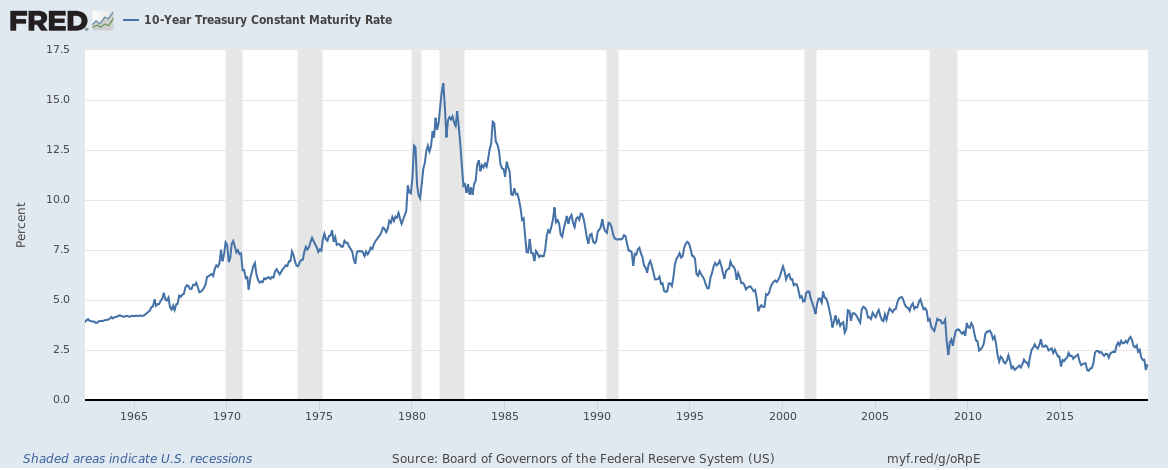
That perpetually growing mountain of debt was only sustainable for 40 years because interest rates fell the entire time (from 15.84% in Sep 1981 to 0.54% in March 2020).
 Those of you old enough will remember the worry about Reagan’s deficit spending and why politicians of the day were afraid the interest payments would eat the budget alive. High debt x high early 80’s interest rates = a mountain of interest payments. Notice in the graph below that the interest payments on Federal borrowing during the Great Recession bubble is much smaller than interest payments due to Reagan’s borrowing, even though similar dollar amounts were borrowed, because interest rates were much lower in 2008 than 1981.
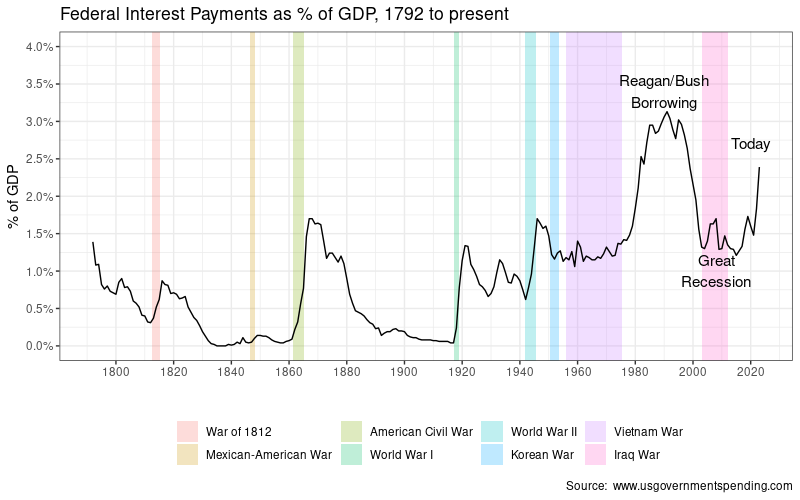
The average US debt has a maturity of 10 years, which is why it took 10 years for interest payments to peak after Reagan’s borrowing spree. Fortunately a mixture of spending cuts, Clinton’s tax increases on the wealthy, and the fortuitous invention of the Internet helped bring interest payments back to earth.
Now that interest rates have started rising again, we’re in a new era. Rising debt x rising interest rates = interest payments that will rapidly grow and crowd out other priorities like education, defense, science, Social Security, Medicare. Rising interest payments are the “debt limit” on our credit card, and the point where we need to stop borrowing and pay the debt down, or else face much worse problems down the road.
“Credit buying is much like being drunk.
The buzz happens immediately, and it gives you a lift.
The hangover comes the day after.” – Joyce Brothers
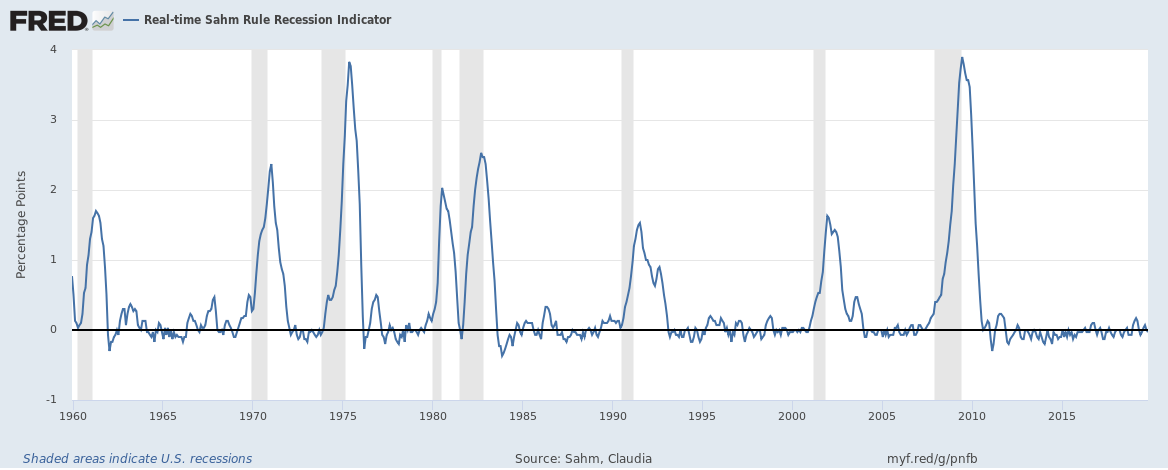
When someone with a credit card hits their limit, they have to start paying down their debt. They go from feeling richer than they are to poorer then they are until the debt is paid down, which feels like a sharp decrease in their standard of living.
We probably have 5-10 years before the current debt growth starts to cause major issues. Exactly how that plays out will be “interesting” to say the least. It’s possible that interest rates stabilize at a lower level, in which case the pain will be comparatively mild.
But if interest rates keep growing or borrowing doesn’t slow down, whoever wins election in 2024 or 2028 is likely to face some very painful and extremely politically unpopular decisions. It will require some mixture of low growth, higher taxes, budget cuts, and inflation that will feel like the decrease in standard of living that I mentioned earlier.
I’m concerned that the latter situation (rising rates) is already starting to slowly play out.
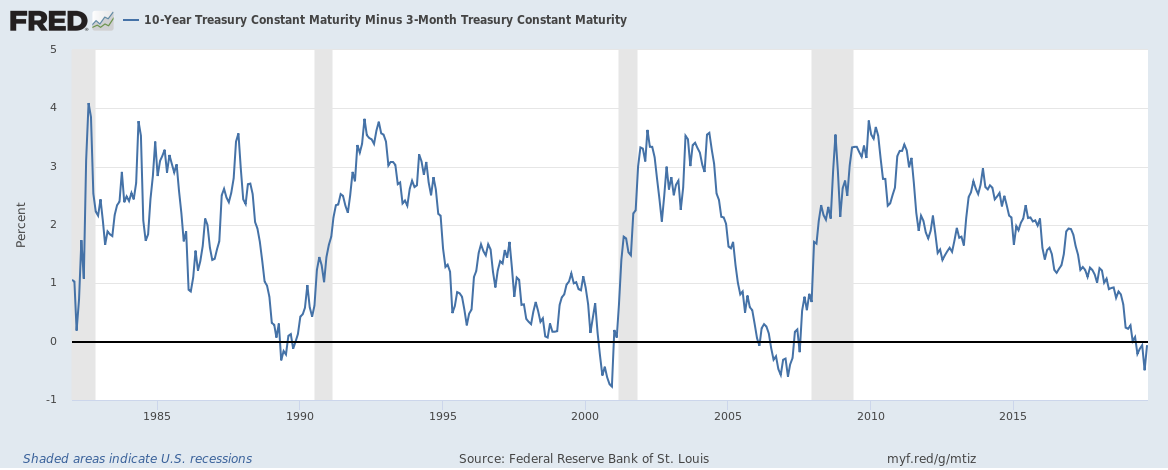
Normally interest rates are dictated by the Fed. The Fed decrees that the Federal Reserve Rate is 3%, and all other US Treasuries tag along at 3% plus a bit extra.
But now we’re entering an era when interest rates will be dictated less by the Fed and more by supply and demand for that debt, and buyers are increasingly growing concerned about the size of the debt.
The US borrows by selling US Treasuries at a monthly auction. In recent months, the Treasury has had problems finding enough buyers for the Treasuries they’re selling at the yield the Treasury would prefer, so the Treasury has been raising rates (and thus profit for buyers) to try to attract enough bidders to sell their monthly allotment.
Think about it from the buyer’s standpoint. As US debt snowballs, the buyer is taking a greater risk in buying US Treasuries due to the possibility of inflation or default. So they very rationally want to be compensated for bearing that higher risk. This is part of why interest rates have gone up the past year.
I’m not sure how all the above plays out. If handled well, it could merely result in an extended period of low growth and “malaise” that isn’t too bad. Or it could cause a truly epic recession. A lot of it depends on political decisions between now and then. All I can tell you is watch the news and be ready for anything.
Fixing inequality is easy, in the sense that we already know how to do it: Raise taxes on the wealthy and redistribute the money they took from the poor/middle class right back to the poor/middle class.
It’s hard in the sense that elected officials often don’t have either the incentive or the power to make the necessary changes, the wealthy hate higher taxes and less wealthy, and a lot of voters don’t understand the necessity or are distracted by “culture wars” (funded by those same wealthy) into voting against their own interests. They think their distraction is a symptom of the world getting worse, but the world is getting worse *because* they are distracted.
The GOP will not voluntarily reduce inequality as they and their predecessor parties have always been the party of the wealthy and big business. Fixing it will require the Democratic party to win the White House and both Houses of Congress by sufficient margin to push legislation to the President’s desk.
The 50%+1 razor-thin wins of recent election cycles are insufficient. It will take an election blow-out that gives Democrats unassailable margins. But the Democratic party is too busy pushing social issues and chasing Wall Street donors to attract enough votes from economically-minded voters to win that necessary margin. So Democrats aren’t likely to be much help either for the moment.
So I expect inequality to continue worsening, until one day something “breaks” (a war or recession are historically the usual triggers) and forces a redistributive solution.

The graph above shows US unemployment since 1800. The “Great Depression” is the large and broad unemployment spike in the center of the graph. It truly was horrific, easily eclipsing other panics or depressions like the Long Depression of the 1870’s or the relatively recent Great Recession of 2008.
The extreme inequality that had festered during the Gilded Era was thus compounded by the mass lay-offs of the Great Depression, and led to the rise of radical movements (fascist, communist), labor strikes, race riots, and widespread social unrest, which is largely analogous to what we’re seeing today.
The threat of violence was such that the wealthy eventually chose to acquiesce to laws like FDR’s New Deal that redistributed their wealth as it was, as one historian put it, “an expression of their preference for a legislative revolution to a violent and bloody revolution in the streets.”
I suspect Gilded Age 2.0 will follow a roughly similar playbook: Things will get worse for the average person, first slowly then all at once, and force change. We’ve been doing the slow walk for 40 years, so I suspect the “all at once” stage will probably not be much longer in arriving.
“And what rough beast, its hour come round at last,
Slouches towards Bethlehem to be born?”
– William Butler Yeats
Back in the 90’s, outsourcing jobs to China took off. The prevailing economic theory was that it would make prices so much cheaper that both capitalists and labor would be left better off if they shared the excess.
Problem is, capitalists don’t like sharing money. So they helped craft laws to ensure that most/all of the gain was steered directly into their pocketbook, leaving little/none for labor. They’re doing better than ever.
Workers affected by outsourcing saw their jobs moved to China, their factory close down, their livelihoods destroyed, and their hometowns economically shattered, which is a large reason why those same workers showed up in droves to help elect Trump to the presidency.
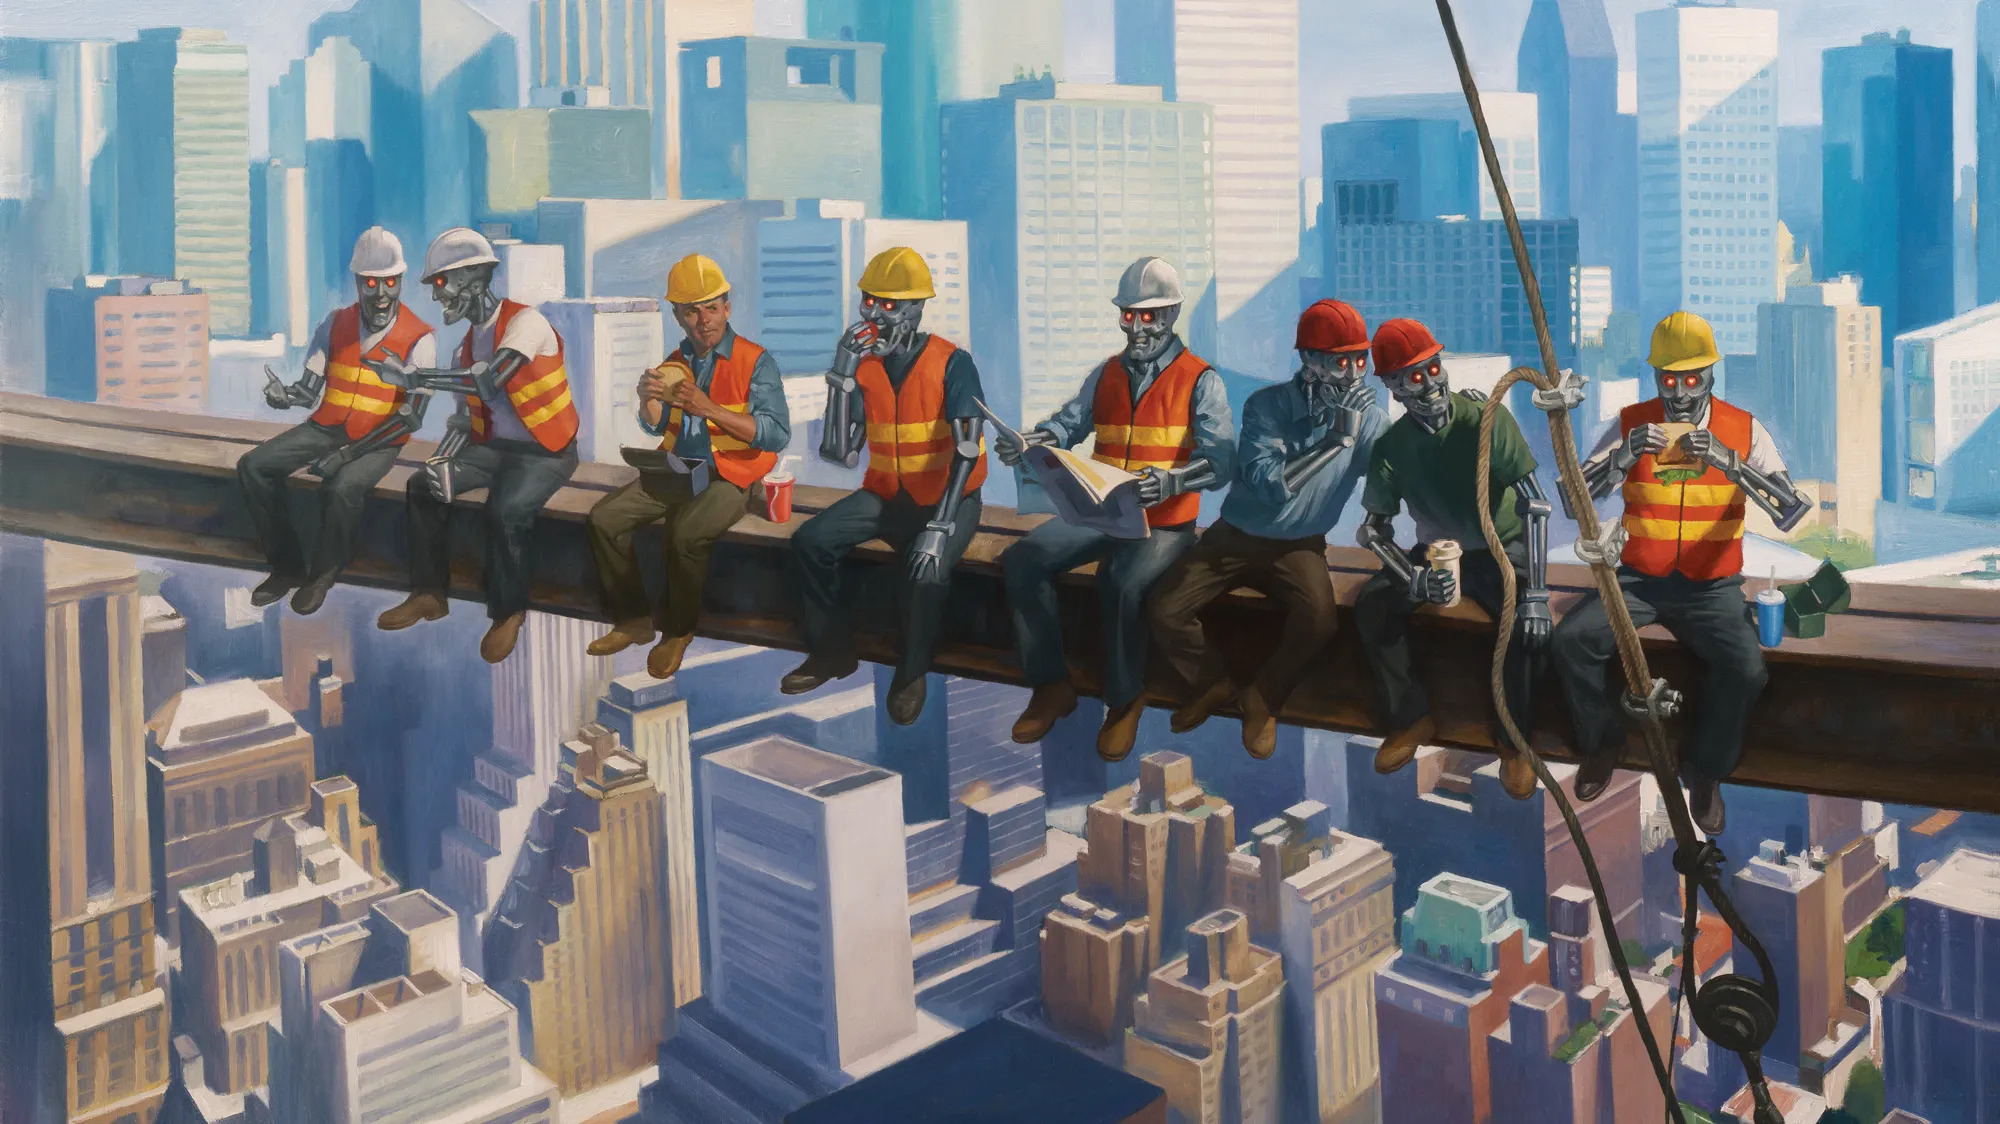
We’re coming up on another moment like that. In coming years, AI is poised to rapidly accelerate job destruction, far faster than capitalism can create new jobs to replace them. And many of the people employed in jobs facing extinction are probably ill-adapted for other jobs, or they won’t be as high paying.
In theory, we could divide the gains from AI in ways that would ensure that both capital and labor would benefit. But do you really think we’ll actually do that this time if we didn’t do it for those displaced by outsourcing since the 90’s?
Those newly unemployed are unlikely to go quietly into that good night. They are the seeds of radical movements and social unrest of the 21st century, and they won’t take long to sprout.
I had originally intended my “Wars and Rumors of Wars” to be one post, but it’s proving so fruitful to myself (and probably exhausting for the reader!) that I decided to split it into multiple posts over coming months to keep it manageable.
- Part 2 will cover Hegemonic Rivalry, the Thucydides Trap, and World War.
- Part 3 will cover Environmental destruction, climate change and the “Tragedy of the Commons”.
- Part 4 will cover interactions between the 3 “cycles of chaos” that are likely to compound our miseries, and my broad-stroke predictions of where the near-term future is likely to go over the next few decades.

 It’s easy to blame Republicans. They’ve spent four decades obsessed with procuring tax cuts and subsidies for the wealthy at any cost. It’s why the GOP is desperate to focus voter attention on LGBT’s, immigrants, or any other distraction they can muster. The GOP and their wealthy benefactors would lose enormously if voters stopped blaming others for their anemic paychecks and started blaming the wealthy.