P90X, End of Round 2

In September I tried expanding my diet to include additional food like cheeseburgers and brats (eating chicken/turkey/fish/chile every meal of every day was getting extremely monotonous). After a couple of weeks, I reluctantly accepted that I no can haz cheeseburger.

34954886

In October, I had a shoulder and a knee start acting tweaky, and for a couple of weeks that limited how much exercise I could do before having to stop. I was lucky to get 10-15 minutes a day in before one or the other started hurting too much (divebomber push-ups and jump-knee tucks, I’m looking right at you).

And throughout the entire last 90 days, I’ve missed a lot more days that I did the first time.   A seemingly endless torrent of early morning/late evening meetings and general exhaustion working up to our big conference of the year managed to disrupt my exercise routine every time I managed to get back in the groove.

And the worst part is football season is bringing out the chef in *everybody*.    I don’t have any problems turning down food I can’t see.   Put a plate of mac ‘n cheese in my face, and suddenly that devil on my shoulder gets a lot harder to ignore.

P90X_Round2

So here’s day 180.   I went from 168 lbs to… 168 lbs.  Given all the above, I guess that’s not too bad.  My pants are a little looser, I can’t “pinch an inch” as much as last time, I don’t have to use quite so much imagination to see two abs lurking about, so I’m sure I traded a pound or two of fat for muscle.  But it wasn’t nearly the improvement I saw last round.

exercise

On the plus side, I did see good improvements on the cardio side of things. There are two popular measures of heart fitness: maximum heart rate, and heart recovery rate (how quickly your heart slows down after exercise). My heart hit 189 bpm (up from 175 bpm in round 1) after 30 seconds of double-time jump-knee tucks, and dropped 66 bpm within two minutes, both of which suggest I have the heart health of a man 10+ years younger.

image

So here’s hoping the next 90 days go a lot smoother.   I think they will.   Fall is always the hardest season at work.   My aspirations for the end of round 3:

two_wolverines

Hey, delusions are free so you may as well have big ones. 🙂  He’s 5 years older than me, so I think I can catch him.  Do your best and forget the rest. And keep pressing play.

Oh, and read this.  There’s some really provocative stuff there.

Posted in Uncategorized | Leave a comment

P90X, End of Round 1

Ok, it’s been 90 days of P90X.   I’m posting my before-and-after, partly to set the bar for the next 90 days (backsliding is way too easy, especially with mom’s cooking…), and partly to inspire/challenge my friends to give it a try too.

3P90XRound1

I’m gettin’ there.  🙂  I am down 17 lbs (185 to 168) and went from a tight 34″ waist to a loose 32″.   I’ve gone from doing 3-4 pull-ups, to doing 15. I’ve gone from doing 20 push-ups to doing 40.  I feel fantastic, like I could punch a hole in a brick wall.  I am a *very* happy customer.  P90X is a very well-rounded and strenuous exercise program, and Tony Horton does a amazing job of motivating you on those days you feel like staying glued to the couch.

That said… 80% of what I’ve done is just diet and eating right.   A couple of years ago, I ran 25 miles a week every week for two straight years, ate whatever I wanted, and barely lost 10 lbs.  A few years later, two years of full-time work + full-time grad school had packed the pounds back on and then some (and then some…)   I started eating right, did no exercise more strenuous than read the newspaper in the sauna after work, and lost 50 lbs in 8 months.  So diet is the key.  Almost no amount of exercise can counteract a bad diet, and no exercise is necessary with a good diet.   But combine exercise with a good diet, and you can see good results quicker.

A diet high in lean protein (75% of your caloric intake), and a small portion of low-glycemic carbs (25% of your caloric intake) helps burn fat.   Your body burns carbs first, and only once you’ve run low will it start burning fat.  Low-glycemic carbs like brown rice and beans take your body longer to digest.   Your body needs a certain amount of energy at all times due to your metabolism plus whatever activity you’re currently engaged in, and since low-glycemic carbs digest slowly, your body will burn fat to make up the difference. You can find info on the glycemic index by clicking here, entering a food, and then looking at the “Estimated Glycemic Load” box.  The lower the better.

Simple carbs like sugar, flour, potatoes are bad for you two ways.  One, your body can digest them quickly, which means any carbs you can’t burn at that moment get stored as fat.  Two, your insulin spikes when digesting simple carbs, and when it crashes you get very hungry.  So simple carbs are a double hit.  Complex carbs and protein keep you feeling fuller longer on fewer calories.

Just as important as what you eat, is how much.  That whole “feeling fuller longer on fewer calories” the above diet gives you *REALLY* helps, because you’re going to be counting calories, and sticking to a diet is vastly easier when you feel full and sated instead of constantly on the verge of starvation. A sample of P90X’s diet plan is available by clicking here, and page 3 has a simple calculator for determining how many calories you should eat.

My weight loss plateaued about a month ago.  I hit 170.0, and started gaining a bit (got back to 173 or so).  That happens.  I have no idea why your body can plateau for several weeks, but it can’t violate the laws of thermodynamics forever, so stick to it and keep pressing play.  Historically I’ve noticed that whenever I plateau, it usually takes a month or so to break through it, and sure enough in the past week or so I’ve started losing again.  So *when* (not *if*) it happens to you, just keep your chin up and keep hustling.     Do your best, and forget the rest.

Give it a try!  And see you in 90 days.  Where are *you* going to be 90 days from now if you don’t?  🙂

Posted in Uncategorized | Leave a comment

Happy days are (almost) here again…

I’ve posted numerous blogs on what bad things could happen to either the US or local economy, so today I wanted to post about some of the good things that are likely to happen.  While the US still has to face the “deficit cliff / debt ceiling” over the next few months, and Europe is still firmly in “kick the can” mode, I am becoming cautiously optimistic that good times are a year or two away, and that they will benefit both workers and investors.

  1. Oil will almost certainly grow more expensive as time goes by.   If you are commuting to Nashville every day, you may have a hard time seeing how that’s good news for the US economy.   But as the cost of transporting goods across the Pacific rises, manufacturing goods here in the States starts to make more sense.
  2. On the other hand, the price of natural gas is expected to plummet.  Fracking is predicted to allow the United States to displace Saudi Arabia as the world’s top energy producer within the decade.  It is less economical to ship natural gas than it is oil, so more of it will be used here.   That means cheaper energy, as well as cheaper inputs such as chemicals and plastics.   So at the same time the price of transporting goods from China is going up, the price of manufacturing here will fall.  (China does have its own natural gas deposits, but they are much harder to access.)
  3. Jobs were shipped to China because the low wages more than compensated for the extra costs in transportation and other areas.   But Chinese wages have been rapidly increasing over the past few years.   As the salary gap between China and America shrinks (combined with the rising cost of fuel) it increases pressure to either ship jobs back home, or to find lower-paying regions such as Bangladesh, Pakistan, and Africa.
  4. Because of these trends, GE is starting to move some manufacturing from China back to their plants in Louisville.   GE is one of those bellweather companies that’s usually a bit ahead of everyone else.   So assuming the same MBA herd mentality that sent jobs to China in the first place is still alive and kicking, over the next few years those MBA’s will start emulating GE’s strategy and begin moving more jobs back here.
  5. Jan Hatzius said so.

So I’m starting to think about a) how I can benefit as an investor, b) how other workers can benefit, and c) how Cheatham County can be prepared to capture this growth when it comes back.

I know a lot of people have been burned by the past couple of years, and don’t trust the stock market.   But those are usually the best times to invest, and I don’t believe this to be a exception.   The “easy” smart thing to do would be to invest in a S&P stock index, as much as you can afford.   And you *definitely* want to use tax-advantaged investment vehicles like your 401K or a Roth IRA, because for several reasons I expect taxes on both capital gains and dividends to rise substantially over the next decade.   (If anyone’s curious I do have a few ideas about “harder” smart things that have a higher risk/reward, so email me if you’re curious.)

For workers, the benefits of this manufacturing boom probably won’t accrue evenly.   Manufacturing will be moving back, but that doesn’t mean jobs will.   Modern manufacturing will have more automation and fewer (but smarter) workers.   So the person with a high school degree will continue to lag behind, whereas the person with training in a STEM field such as robotics, electronics, IT, etc should be poised to reap an above-average income.

I’m still thinking about how Cheatham County can tap into this growth when it comes.   The answers are investments in infrastructure and education, and the sooner the better.  This is already well-known to most of the movers and shakers I’ve talked to.  The problem here is politics, and expectations.   Funding these investments almost certainly requires a tax increase of some sort.  But the average citizen hears “tax” and their hair bristles.  There’s an almost Pavlovian reaction.  The same people who are failing to invest in their own retirement, have an even harder time understanding government making investments on the public’s behalf.   We either need to elect a slate of politicians unafraid of committing career suicide to do the right thing, or we need to do a vastly better job on informing residents and helping them see the big picture.   I have some ideas, but this is the toughest nut to crack of all of them.

Posted in Uncategorized | Leave a comment

Cheatham Unemployment

I am studying long-term trends in Cheatham County’s economy and would love to pick people’s brains for info.  To start off my story, here’s a graph of Cheatham County’s unemployment rate (in blue) alongside Tennesseee’s (red).   You can see that Cheatham has a lower unemployment rate than the state.
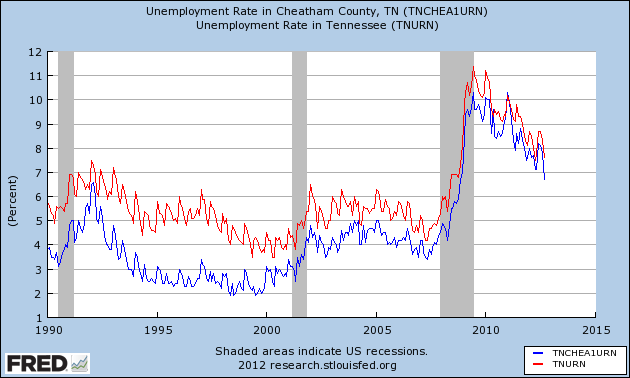
You can see the good times, the bad times, the booms, and the recessions.

I can filter out national- and state-level events by taking Cheatham’s unemployment rate and subtracting Tennessee’s unemployment rate.  What’s left shows trends arising from factors inside the county and give us an “x-ray” to see how good or bad the county was doing.  It shows that Cheatham has had lower unemployment than the state for decades and that has helped us a lot, but things have been getting steadily worse for almost 20 years, and we’re a few years away from having *higher* unemployment than the state:
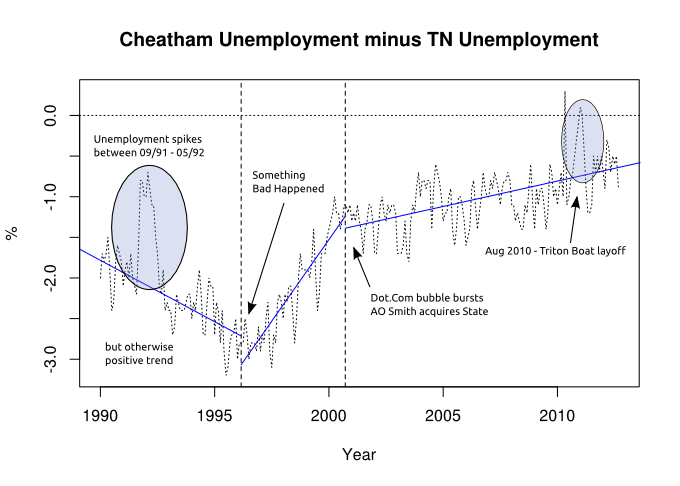
(The annotations are my best-guess as to what’s going on, and if you have any better ideas, I’d love to hear them).

From 1990-1995 things were generally going great (except for a ~8 month rough patch between 08/91 – 05/92.  What is that?  Temporary layoffs at State?).   Unemployment was consistently 2-3% lower in Cheatham than the rest of the state, and it was getting even better as time progressed.   It was easier to find a job here, and that helped attract a lot of growth to the area.  Local employers had to compete a little harder to get workers, which meant higher incomes and better benefits.  Times were good.

And then, Something Bad Happened.   I’m not 100% certain what It was, other than a few hunches.  Between 1996-2000 Tennessee’s unemployment (red) started rapidly falling, while Cheatham’s unemployment rate (blue) stayed the same.  That suggests that rather than doing something wrong, we failed to do something right that other counties were doing.
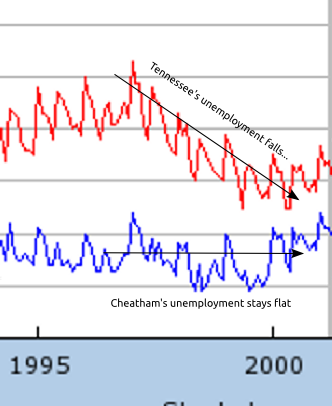
I believe the data is showing the extent to which Cheatham missed out on the dot.com boom.  Other counties saw a small explosion in IT-related jobs.  They also had other industries (healthcare, entertainment) positioned to reap the benefit from either IT innovation or the general positive economic climate, and they flourished.  We didn’t have those (if the economy booms are you going to buy *two* water heaters?), so ours stayed the same.  The wind was blowing, but we didn’t have any sails.

In 2001, things got a bit better, at least relatively.  Our downhill slide didn’t stop, but at least it started growing worse at a slower rate.  Given the timing, my guesses are 1) the bursting of the dot.com bubble affected us less than the rest of the state and/or 2) AO Smith’s acquisition of State put the business on firmer ground. Between 2002-2010, Census data shows job growth in manufacturing, education, healthcare, and arts & entertainment in Cheatham failed to keep pace with the rest of the state.

Part of the drop in the “unemployment gap” can be explained by the blindingly obvious:  the number of people available to work (civil workforce grew by 761 between 2002-2010) grew faster than the number of in-county jobs (266 between 2002-2010).  There are currently only 2 in-county jobs for every 5 working residents, so Cheatham needs to be working much harder to attract and keep jobs (hello, Red River Industrial Park…)

But another part is the types of jobs available in the county.  82% of residents leave the county for work (I am one of them!), either because they earn more money outside the county or Cheatham doesn’t offer jobs in their field. In-county jobs are increasingly staffed (60% of all in-county jobs today, and growing 1%/yr) by commuters from poorer counties, which itself further hinders job creation by local daytime businesses like restaurants and grocery stores.
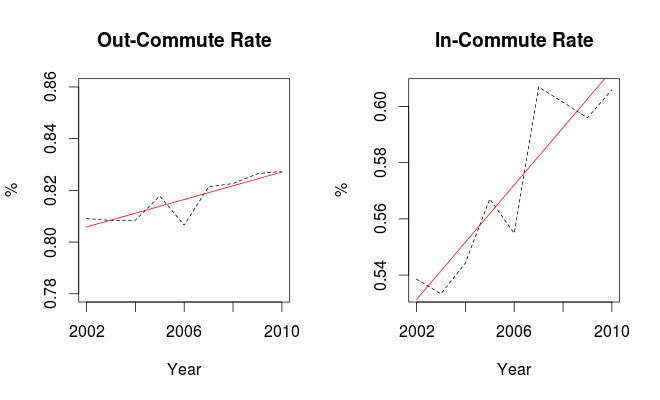
As more residents work outside the county, our unemployment rate is going to be a lot more “average” than it otherwise would, and since 60% of the county works in Davidson, it’s no coincidence that our unemployment rate is starting to look a lot like theirs.

While residents earn more money by commuting, it doesn’t do much to help local employment unless they spend it in-county.  I don’t recall the last time I left work at Vandy, and drove past Chago’s, Chuy’s, Pei Wei’s, Mirko Pasta, Mellow Mushroom, Genghis Grill, Judge Beans, and Baja Burrito to eat in Cheatham.  I usually eat and shop close to work.  Unfortunately for the county, so does that other 82%, and as that percentage grows it is becoming more and more a hindrance to local job creation (ask the local restaurateurs about that!  It drives home how smart Steve Stratton had to be to stay in business so long).

So there are a number of forces pulling us in the wrong direction.  By extrapolating the current trend out, sometime after 2022 it will become *harder* to find a job here than elsewhere in TN.
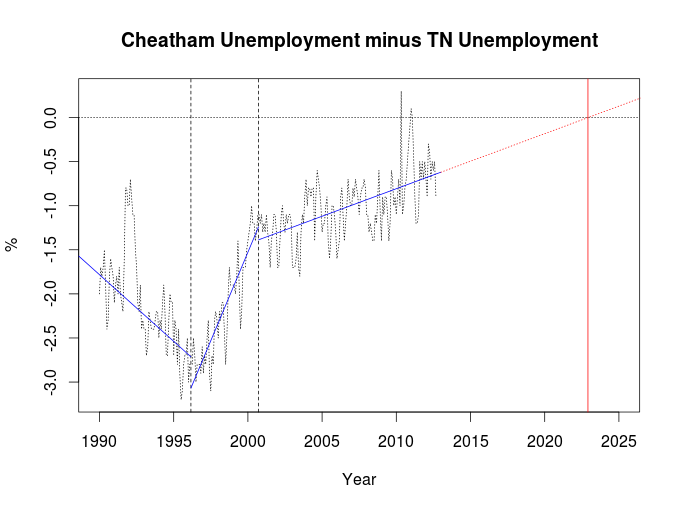
That will cause people to reconsider moving into the county, increase pressure on existing residents to look elsewhere in search of jobs, and doesn’t bode well for real estate values, incomes, business investment, taxes and government, and a number of other areas.    The county’s current trajectory is somewhere between “bedroom community with no kitchen or living room” and “The Grapes of Wrath”.

And then there are the wild cards, like the cost of fuel and technological innovation.   If the real cost of oil goes up in a sustained way (and unless you think China and India are going to turn their back on cars and go back to bicycles, it eventually will), some fraction of those 82% of residents who commute will have to take a long, hard look at living closer to work, because there’s no option for them to work closer to where they live.  The transportation sector added 156 jobs to the county between 2002-2010, more than any other sector.  But what happens to those jobs 10 years from now when self-driving vehicles are a reality?   Given the low margins and intense competition in that sector, companies like Re-West will face incredible pressure to automate their rigs and shed jobs.

Now that I’ve blathered on enough, I’d really love to hear your ideas about jobs and unemployment (past, present, or future).  What else is going on here?  What am I missing?  Do you think I’m wrong?  Please share your story, your piece of the puzzle, in the form below.

Posted in Uncategorized | 1 Comment

Why Cheatham County’s growth is vanishing

I spent the morning examining Cheatham’s slowing growth in Excel and R, and came up with a good model that helps illuminate the cause, and perhaps can start the ball rolling for a solution.

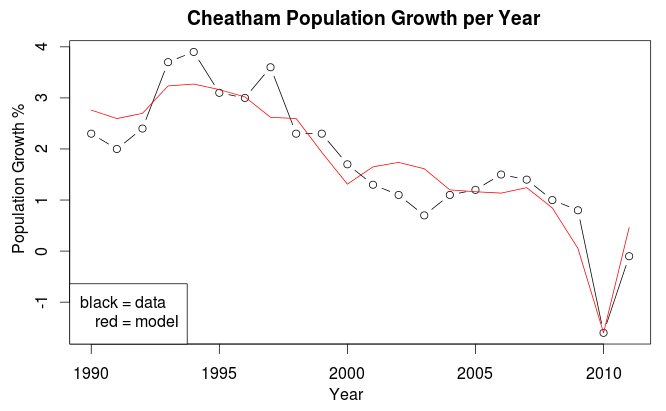
First, the pretty picture to show you how closely the model matches the actual data.  Notice population growth plunged from ~4% per year in the early 90’s to almost 0% today.

I analyzed a number of possible statistics, and found four that were significant (don’t worry if this seems like Greek to you, I’m just throwing them in for the other math geeks).

Coefficients:
                Estimate Std. Error t value Pr(>|t|)   
(Intercept)     9.655e-01  5.054e-01   1.910  0.07313 . 
MankiwFedRate   6.375e-02  4.325e-02   1.474  0.15880 
CheaUnempDiff  -6.345e-01  1.988e-01  -3.192  0.00534 **
AvgImpactFee   -1.323e-04  9.382e-05  -1.410  0.17665   
Flood2010      -1.976e+00  6.830e-01  -2.893  0.01011 * 

Multiple R-squared: 0.8577,    Adjusted R-squared: 0.8242

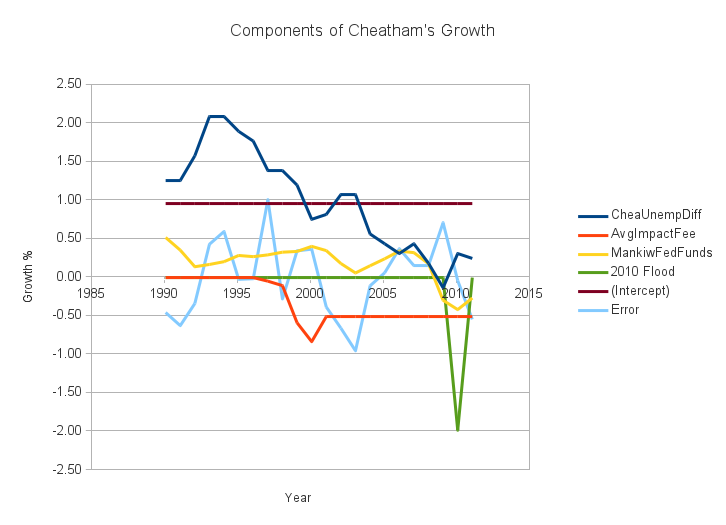
The state of Tennessee grew 1.012% per year over the period in question.  The “(intercept)” parameter (0.9677%) is probably measuring this, and differs slightly due to random noise in the data.  This always contributes positively to growth.

The next statistic (MankiwFedRate) is a measure of the health of the national economy (it combines inflation and unemployment to predict the Federal Funds Rate), and while it have a statistically significant effect, in the best year ever (1990), it only added 0.53% to our growth; in the worst year (2010), it reduced growth by 0.41%, and on average it actually boosts growth by 0.2% a year.

So if the state and national economies are actually helping us, it means the roots of our declining growth problem lie at home.

The 2010 Flood was (we hope!) a once in a lifetime event that knocked 2% off the county’s growth that year.   Not much we can do about that.

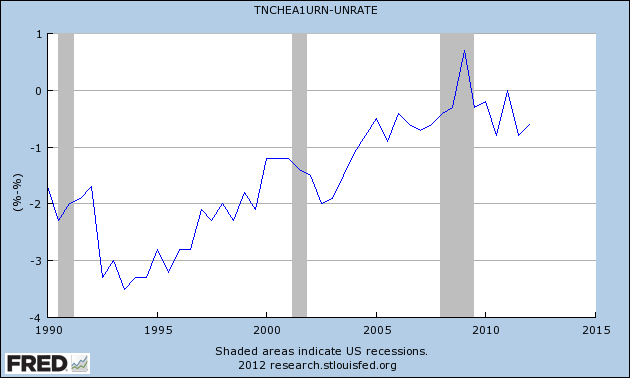
“CheaUnempDiff” is the difference between Cheatham’s unemployment rate and the national unemployment rate.   Historically, Cheatham has had a much lower unemployment rate than the country as a whole, probably due to being a small county and State Industries creating a large number of jobs relative to population.

You can see in the early 90’s our unemployment rate was over 3% below the national rate.  However, that enviable position has eroded away over the years.

My model suggests that if Cheatham could get its unemployment situation back to what it was in 1994, we could increase the growth rate in the county by 1.8% a year.   That one step alone takes us halfway to our best year in two decades (1994, 3.9% growth), and by itself would be more growth than we’ve had in a year since 2000.

That should put a bullet point on the urgent need for economic development projects like the Red River Industrial Park, as well as a need to beef up infrastructure and education to attract more businesses (and hopefully higher-margin businesses).

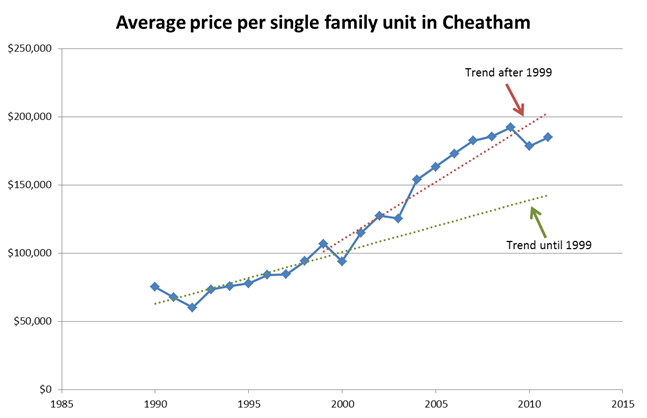
The average price of a new home in Cheatham started growing faster after 2000.   That didn’t happen in neighboring counties.  They either grew at the same pace, or in Davidson’s case actually got cheaper for a few years)

The Impact Fee was introduced in 1999 to tame growth, and it appears to have succeeded at that.  The impact fee is currently $3750.  Multiply it by the “-1.323e-04” coefficient in the table above, and it predicts the impact fee is reducing the county’s growth by about 0.5% a year.  That may have been acceptable when growth was 2-4% a year, but now that growth is negative, it should be urgently revisited.

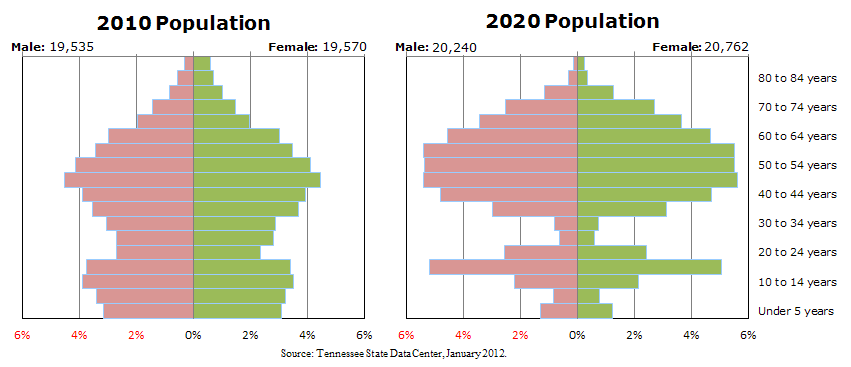
Both of these problems (finding a job and buying a home) disproportionately hit those who are young and just starting off in life, which explains why Cheatham is forecast to lose a significant number of 20-30-somethings (and their children) in the next decade.   If you’re just starting out in life, are you going to move someplace that has fewer jobs and more expensive housing?

But this isn’t “destiny”.   It’s a problem we can solve if we choose too and roll up our sleeves.  Look back at the top graph again, and see where we currently are and nudge it up by 2.3%.   Suddenly all our problems go away.

Yes I know it’s not quite that easy in the real world.   There are all kind of political issues to navigate.  You have to overcome resistance, build coalitions, educate, and keep pushing the rock up the hill.  But compare it to the alternative…

If you are an elected official and would like me to go over this with you sometime, please let me know.  I’m happy to dig into the raw data and show you how I derived this.

You can get a spreadsheet of my numbers by clicking here.

Posted in Uncategorized | 1 Comment