I spent the morning examining Cheatham’s slowing growth in Excel and R, and came up with a good model that helps illuminate the cause, and perhaps can start the ball rolling for a solution.
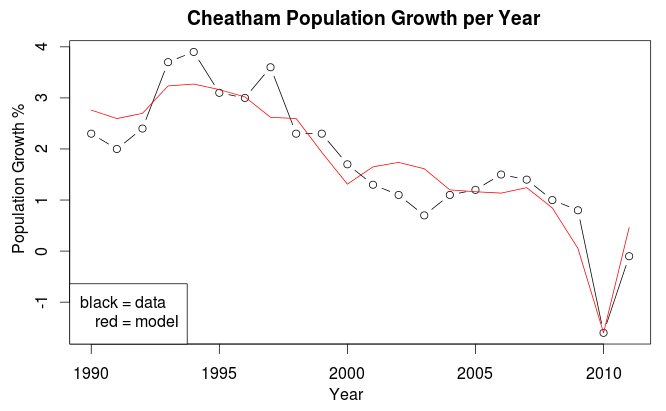
First, the pretty picture to show you how closely the model matches the actual data. Notice population growth plunged from ~4% per year in the early 90’s to almost 0% today.
 I analyzed a number of possible statistics, and found four that were significant (don’t worry if this seems like Greek to you, I’m just throwing them in for the other math geeks).
Coefficients:
                Estimate Std. Error t value Pr(>|t|)
(Intercept)     9.655e-01  5.054e-01   1.910  0.07313 .
MankiwFedRate   6.375e-02  4.325e-02   1.474  0.15880
CheaUnempDiff  -6.345e-01  1.988e-01  -3.192  0.00534 **
AvgImpactFee   -1.323e-04  9.382e-05  -1.410  0.17665
Flood2010      -1.976e+00  6.830e-01  -2.893  0.01011 *

Multiple R-squared: 0.8577,    Adjusted R-squared: 0.8242
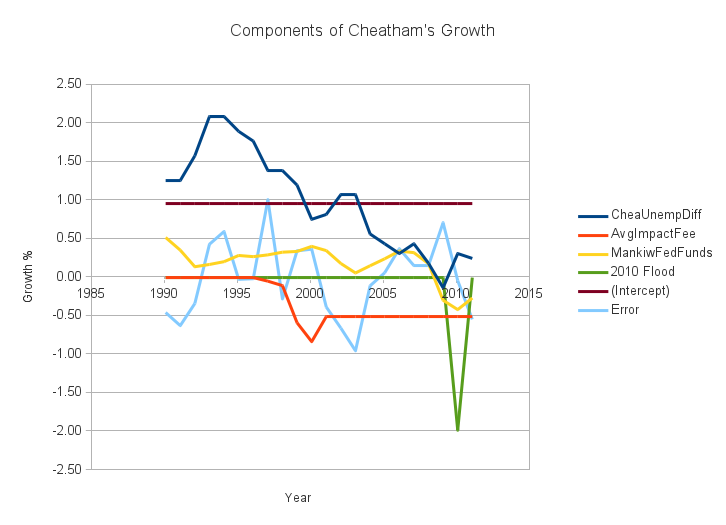 The state of Tennessee grew 1.012% per year over the period in question. The “(intercept)” parameter (0.9677%) is probably measuring this, and differs slightly due to random noise in the data. This always contributes positively to growth.
The next statistic (MankiwFedRate) is a measure of the health of the national economy (it combines inflation and unemployment to predict the Federal Funds Rate), and while it have a statistically significant effect, in the best year ever (1990), it only added 0.53% to our growth; in the worst year (2010), it reduced growth by 0.41%, and on average it actually boosts growth by 0.2% a year.
So if the state and national economies are actually helping us, it means the roots of our declining growth problem lie at home.
The 2010 Flood was (we hope!) a once in a lifetime event that knocked 2% off the county’s growth that year. Not much we can do about that.
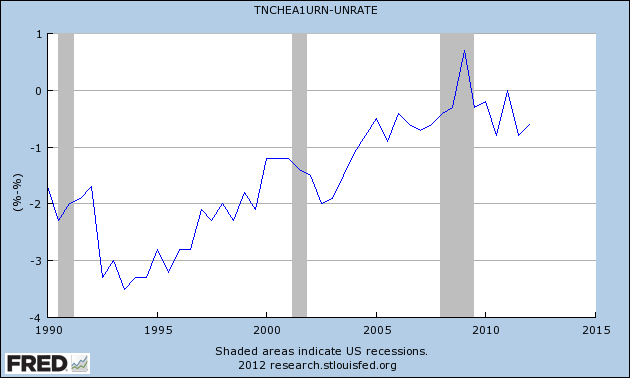
“CheaUnempDiff” is the difference between Cheatham’s unemployment rate and the national unemployment rate. Historically, Cheatham has had a much lower unemployment rate than the country as a whole, probably due to being a small county and State Industries creating a large number of jobs relative to population.
You can see in the early 90’s our unemployment rate was over 3% below the national rate. However, that enviable position has eroded away over the years.
My model suggests that if Cheatham could get its unemployment situation back to what it was in 1994, we could increase the growth rate in the county by 1.8% a year. That one step alone takes us halfway to our best year in two decades (1994, 3.9% growth), and by itself would be more growth than we’ve had in a year since 2000.
That should put a bullet point on the urgent need for economic development projects like the Red River Industrial Park, as well as a need to beef up infrastructure and education to attract more businesses (and hopefully higher-margin businesses).
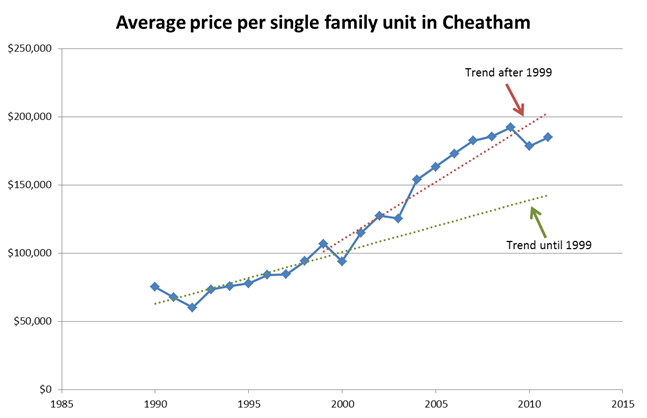
The average price of a new home in Cheatham started growing faster after 2000. That didn’t happen in neighboring counties. They either grew at the same pace, or in Davidson’s case actually got cheaper for a few years)
The Impact Fee was introduced in 1999 to tame growth, and it appears to have succeeded at that. The impact fee is currently $3750. Multiply it by the “-1.323e-04” coefficient in the table above, and it predicts the impact fee is reducing the county’s growth by about 0.5% a year. That may have been acceptable when growth was 2-4% a year, but now that growth is negative, it should be urgently revisited.
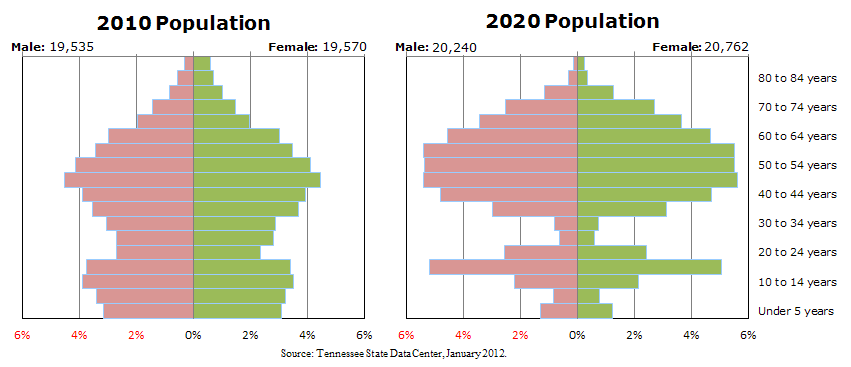
Both of these problems (finding a job and buying a home) disproportionately hit those who are young and just starting off in life, which explains why Cheatham is forecast to lose a significant number of 20-30-somethings (and their children) in the next decade. If you’re just starting out in life, are you going to move someplace that has fewer jobs and more expensive housing?
 But this isn’t “destiny”. It’s a problem we can solve if we choose too and roll up our sleeves. Look back at the top graph again, and see where we currently are and nudge it up by 2.3%. Suddenly all our problems go away.
Yes I know it’s not quite that easy in the real world. There are all kind of political issues to navigate. You have to overcome resistance, build coalitions, educate, and keep pushing the rock up the hill. But compare it to the alternative…
If you are an elected official and would like me to go over this with you sometime, please let me know. I’m happy to dig into the raw data and show you how I derived this.
You can get a spreadsheet of my numbers by clicking here.

When an entire County has only 40,000 people and is adjacent to the State Capitol County, and has few employers and low growth, there is obviously something wrong with the County leadership. Cheatham residents do not want the County to grow!
WE, in Cheatham County have chosen people with NO executive ability nor management nor Public Administration experience to manage OUR County.
WE have lower standards in Cheatham County, lower cost housing, no investment incentives and few services which attract and nurture a lower income population while giving big tax breaks to large land owners. The latter issue has allowed us to enjoy more open space which attracts the “recreational” crowd who contribute little to the County. How about getting Vanderbilt to locate a medical research facility in Cheatham County? If Cheatham Countians wanted growth, they would welcome creative thinking and not be a magnet for those trying to get away from law, order and growth. When I built in Cheatham County 40 years ago, there were 13,000 people.
The front of my property is in the Bellevue sub-area of Davidson County where there were 2,500 people and now 40,000. There were few commercial establishments in the Bellevue area but now there are hundreds! Cheatham County is a small political subdivision of Tennessee with four smaller political subdivisions and 6 or 7 independent Fire Departments and multiple utility districts and utility providers.
Government and utilities are economies of scale….. Cheatham County is unique in its topography and resources and WE need a unified government with a clear growth plan and implementation plan. Our leaders have followed the creeks (which run down-hill) and buffalo paths instead of having a modern plan of growth. I just returned from Beverly Hills, California where life is good but you can be fined $500 for jay-walking and you must have a permit to park in front of your residence or be towed and fined $200.