The best politicians money can buy…

So I had been wondering why CEMC hasn’t rolled out their own broadband Internet.  They’ve got decades of experience with electricity.  They are a natural choice if Bellsouth and Charter aren’t going to provide Internet to everyone.  So I did some Googling…

January 2008:

“But there is reason to be optimistic about the possibilities.  Our legislators have obviously already seen the wisdom of allowing municipal electric systems to offer these services to their urban customers, so why wouldn’t it be appropriate for electric cooperatives to offer these same services to our rural members?” – Carl Wilson Jr., CEMC General Manager

June 2008:

“I guess we underestimated the opposition, which does not want any competition from electric cooperatives in their business.” – Carl Wilson Jr., CEMC General Manager

So what happened in those 6 months?  AT&T, Charter, and other big providers banded together and got our state government to pass the “Competitive Cable and Video Services Act”, which throws huge roadblocks into a municipality or electric utility providing internet service to their customers.

So were our elected state officials doing this because, deep in their heart, they thought it was good for the public?   Let’s see how much money AT&T and Comcast have donated to our legislators over the years….

YEAR     AT&T     COMCAST    TOTAL
---------------------------------------
2004   $11,700     $3,234     $14,934
2006    $1,500       $500      $2,000
2008  $139,782    $61,000    $200,782
2010   $56,450    $47,200    $103,650

So they go from donating a grand total of $2,000 in the 2006 election cycle, to $200,000 in the 2008 election cycle.

We have the best politicians money can buy.  Unfortunately, the average voter isn’t the one with the money.

References:

http://www.cemc.org/general/tnmag/January2008mag.pdf
http://www.cemc.org/general/tnmag/June%202008.pdf
http://www.followthemoney.org

Posted in Uncategorized | Leave a comment

No nostalgia for the 2000’s

I set up this blog to post some of my larger ramblings that don’t fit on Facebook very well.  So here goes…

GDP per capita is a very good way of measuring increases in our country’s wealth.  I had a slow day, so I examined GDP per capita data from the last century.  I wanted to see if the 2000’s were as bad as people made them out to be.  In addition, I gather numbers for the percentage of wealth going to the top 10% of earners.

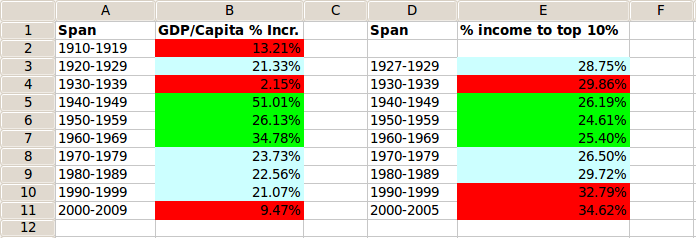
Here’s the result:

A little explanation.  The first highlighted column shows how much the average person’s real wealth increased over that decade.   So by the end of the 1910’s, the average person was 13% wealthier than at the start of the decade.

You can see that the 3 worst performing decades of the past century were the 1910’s (due to World War I and the Spanish flu pandemic), the 1930’s (due to the Great Depression), and yes, the 2000’s (due to the dot.com boom, the Great Recession, and lackluster growth between the two).

Some other things pop out to me.   The 1940’s – 1960’s really were great times to live, relatively speaking.  The country earned tremendous wealth during that era, and more of that wealth found it’s way into the hands of the average Joe.

Compare that to the 2000’s.   Not only was growth over that decade less than half of the previous decade, but a larger share went to the upper 10%.   The top 10% is making 10% more income than they did during the 50’s.  That’s $1.4 trillion dollars a year.  Divided equally among the bottom 90%, that’s over $5,000 a year that the Average Joe is *not* getting.

This isn’t to wail on rich people.   I’d love to be one someday, plus there aren’t enough billionaires in the country to skew the numbers that much.    Most of this effect is due to skilled knowledge workers earning a larger and larger share of the economic pie.

This is all great if you happen to be in the top 10%.   To the other 90%, the 2000’s was a pretty dismal decade to live in.   And unfortunately, this decade isn’t starting off any better.

Posted in Uncategorized | Leave a comment